
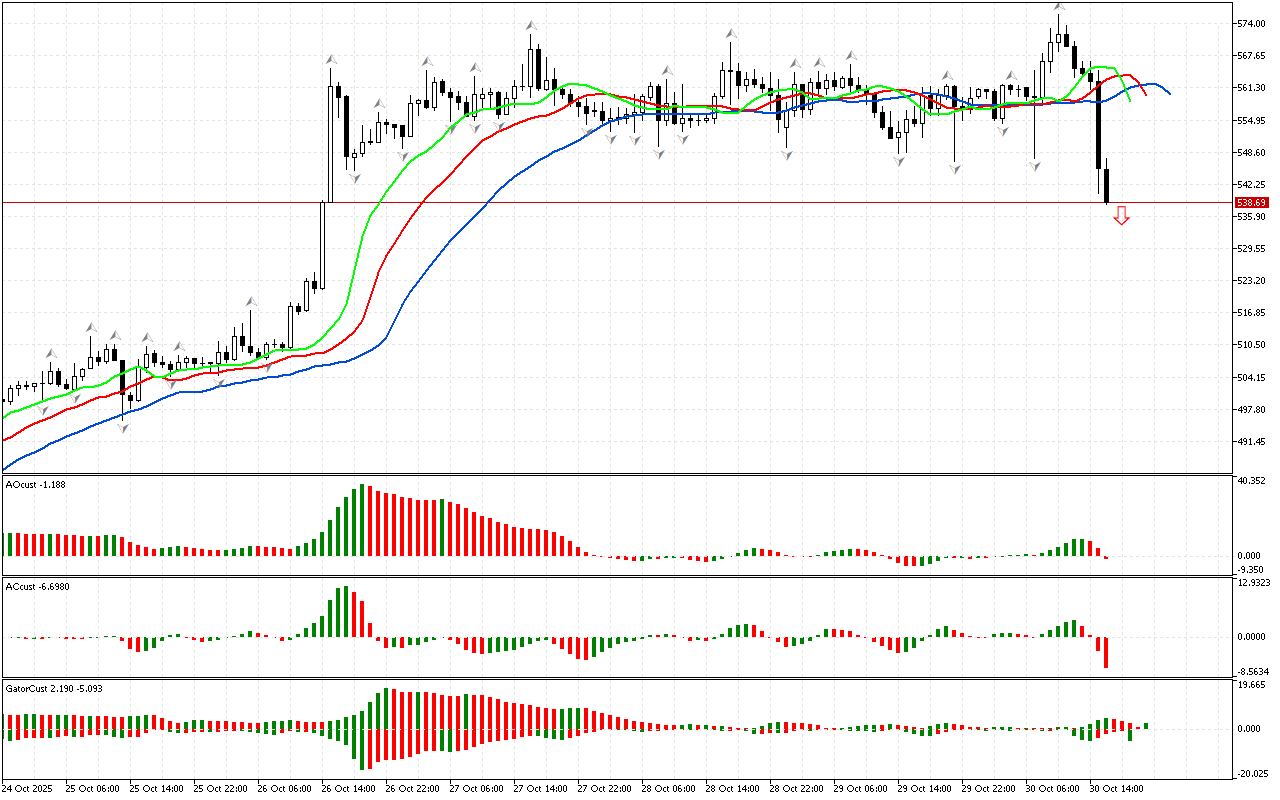
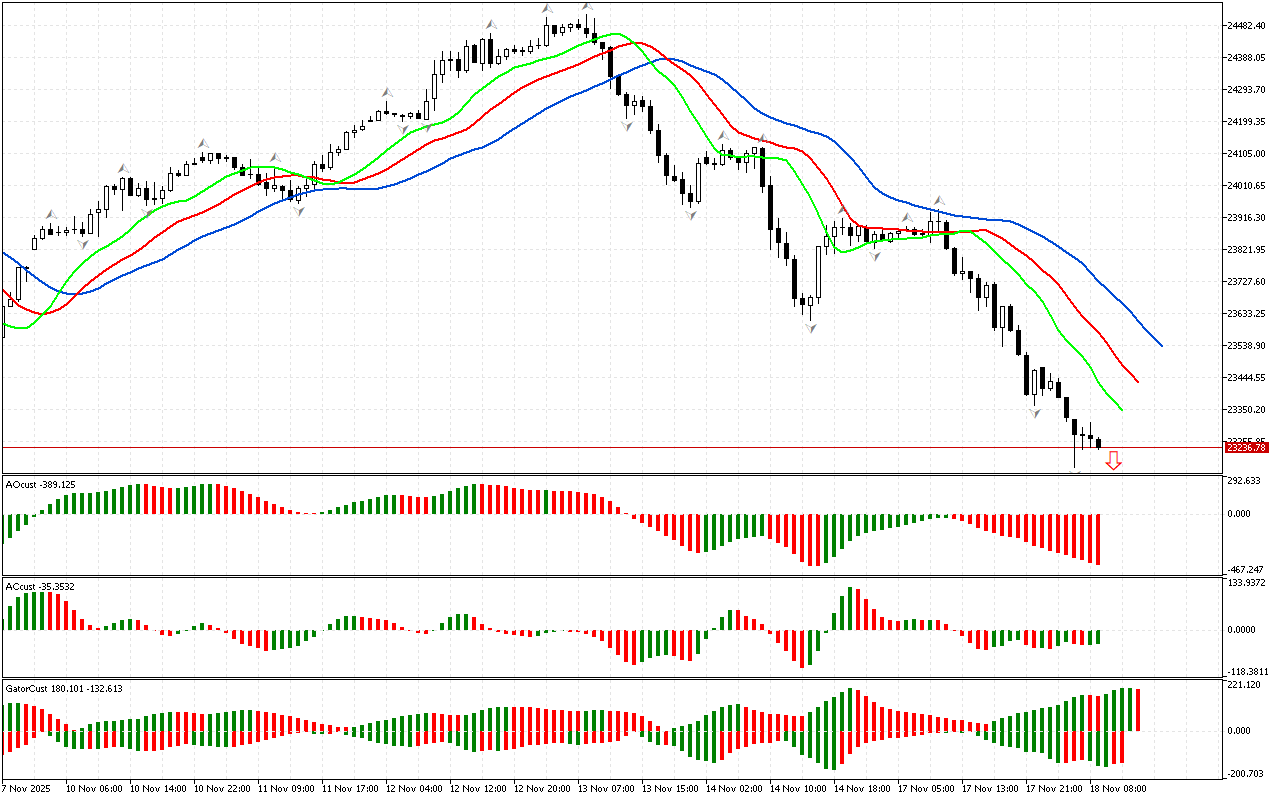
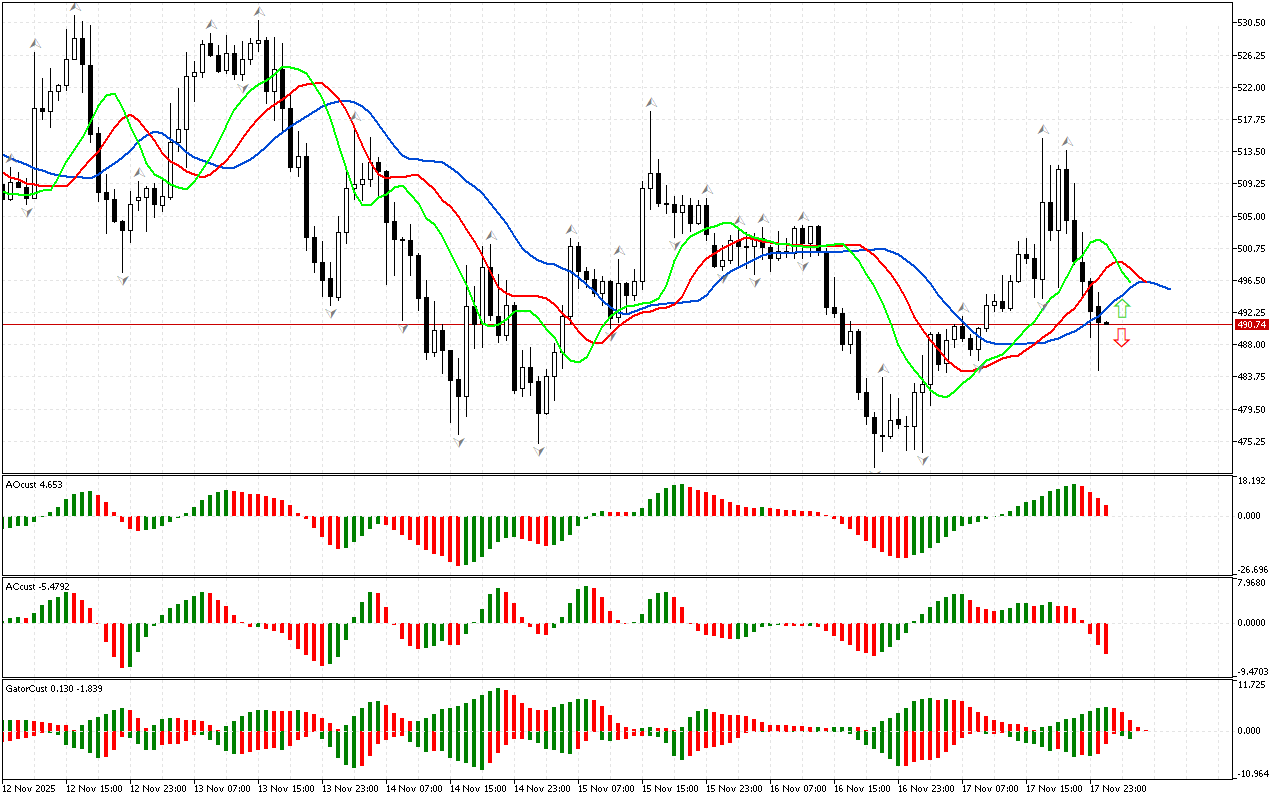
The price has fallen below the lower fractal on the Bit.Cash chart. This means the phase space is defined as southern. Against this background, the downward movement development is considered as prevalent. To assess the prospects for the development of this movement, let’s examine other market dimensions.
At the same time, the Awesome Oscillator histogram is currently above the zero line.
Signals from the AC and AO indicators indicate that the market has sufficient strength and energy to reduce the price further.
The color of the histograms of the Gator indicator changes, so this indicator has not formed a clear signal yet.
As an epilogue to the analysis, the southern direction of price movement is noted to be considered as a priority. At the same time, the indicators contain signals about the possible development of a correction, which should be used to search for entry points at more beneficial prices.
📊 Sell Stop 538.34
❌ Stop Loss 558.03
After entering the market, Stop Loss is moved along the red line after closing each candle. The profit is fixed by moving Stop Loss, or when opposite signals appear on the AO, AC, Gator indicators.

Leave a Reply