
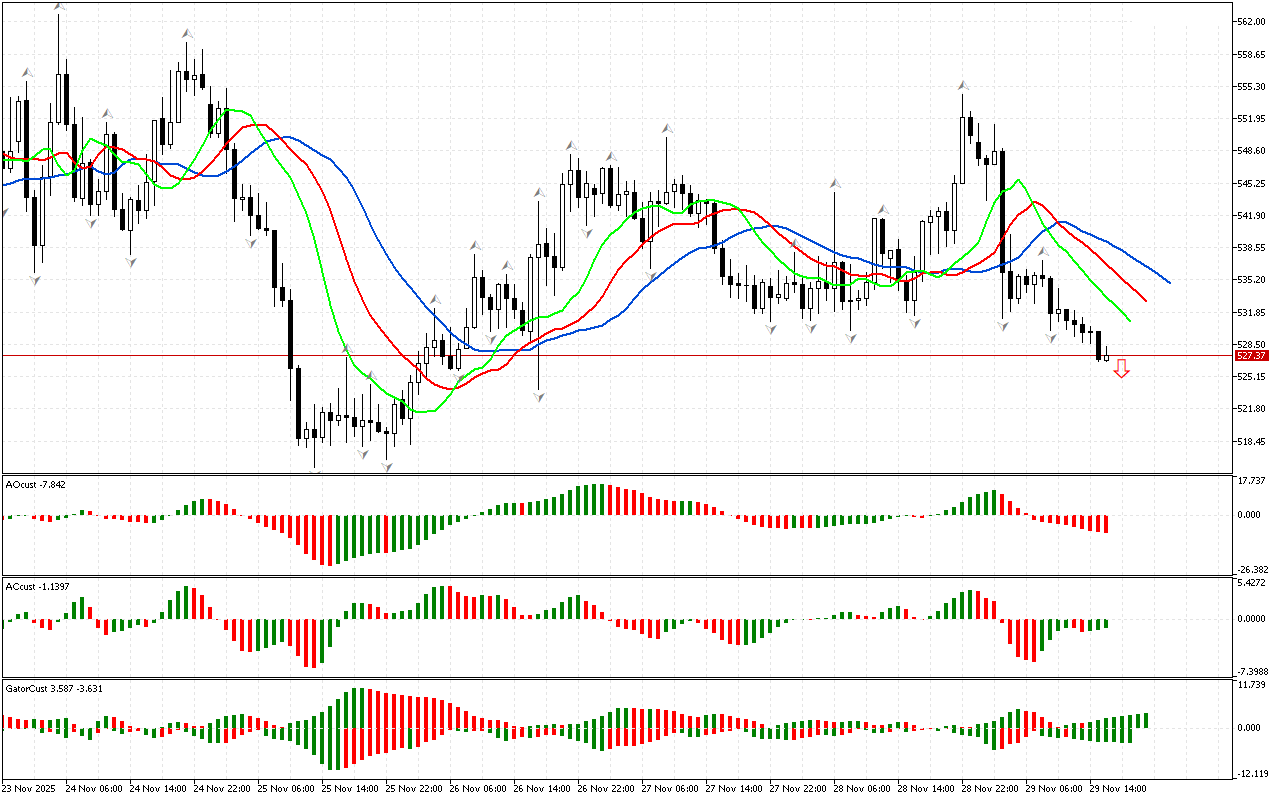
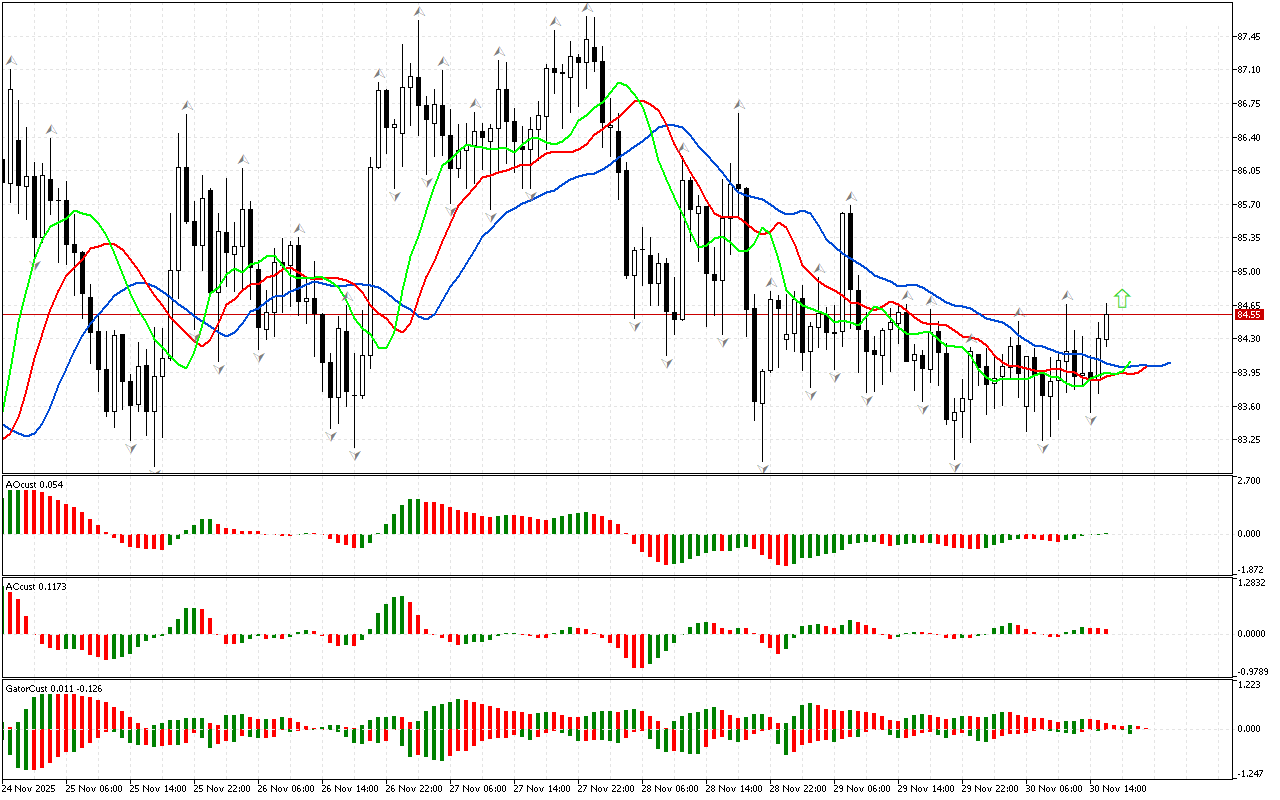
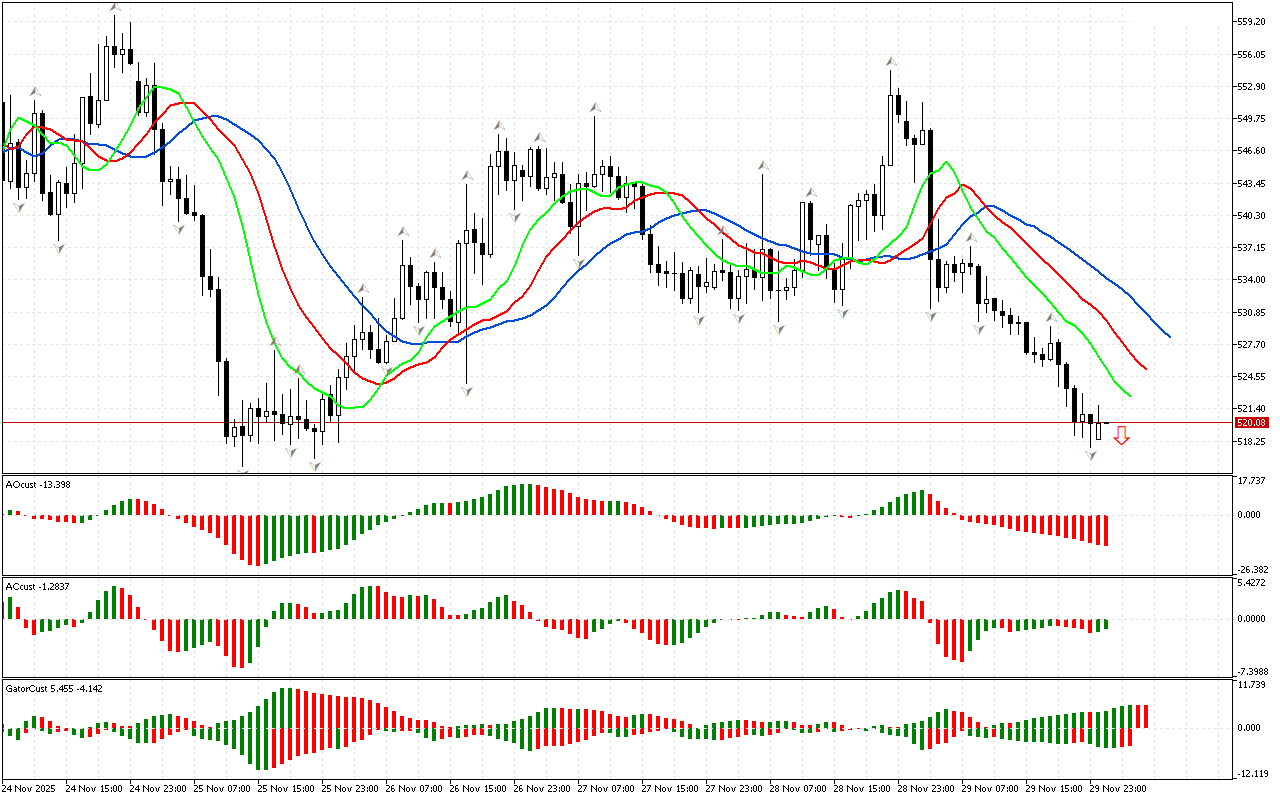
The price has fallen below the lower fractal on the Bit.Cash chart. This means the phase space is defined as southern. Against this background, the downward movement development is considered as prevalent. To assess the prospects for the development of this movement, let’s examine other market dimensions.
The Alligator confirms the signal of the first phase of the market: its mouth is open.
The Awesome Oscillator indicator has consolidated below the zero mark.
It is also worth noting that the last few bars are green on the AC indicator. However, the histogram is below the zero mark. This signal can indicate both: the correction development or a reversal of the movement. Nevertheless, a downward movement remains prevalent as long as the price remains below the Alligator’s red line.
A series of green bars is drawn in the Gator indicator. This shows the Alligator’s gluttony. The Hungry Alligator period is the time when a trend movement develops in the market.
As an epilogue to the analysis, the southern direction of price movement is noted to be considered as a priority. At the same time, the indicators contain signals about the possible development of a correction, which should be used to search for entry points at more beneficial prices.
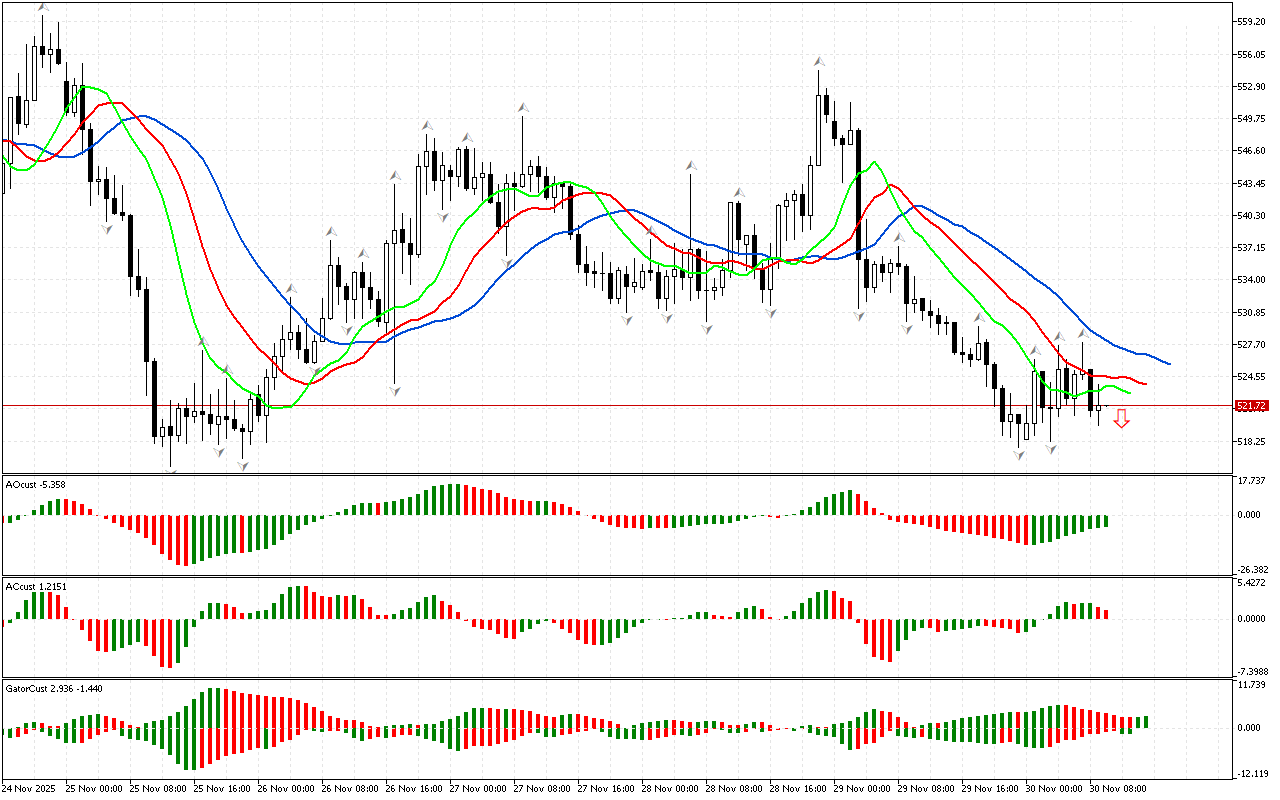
📊 Sell Stop 526.75
❌ Stop Loss 541.69
After entering the market, Stop Loss is moved along the red line after closing each candle. The profit is fixed by moving Stop Loss, or when opposite signals appear on the AO, AC, Gator indicators.
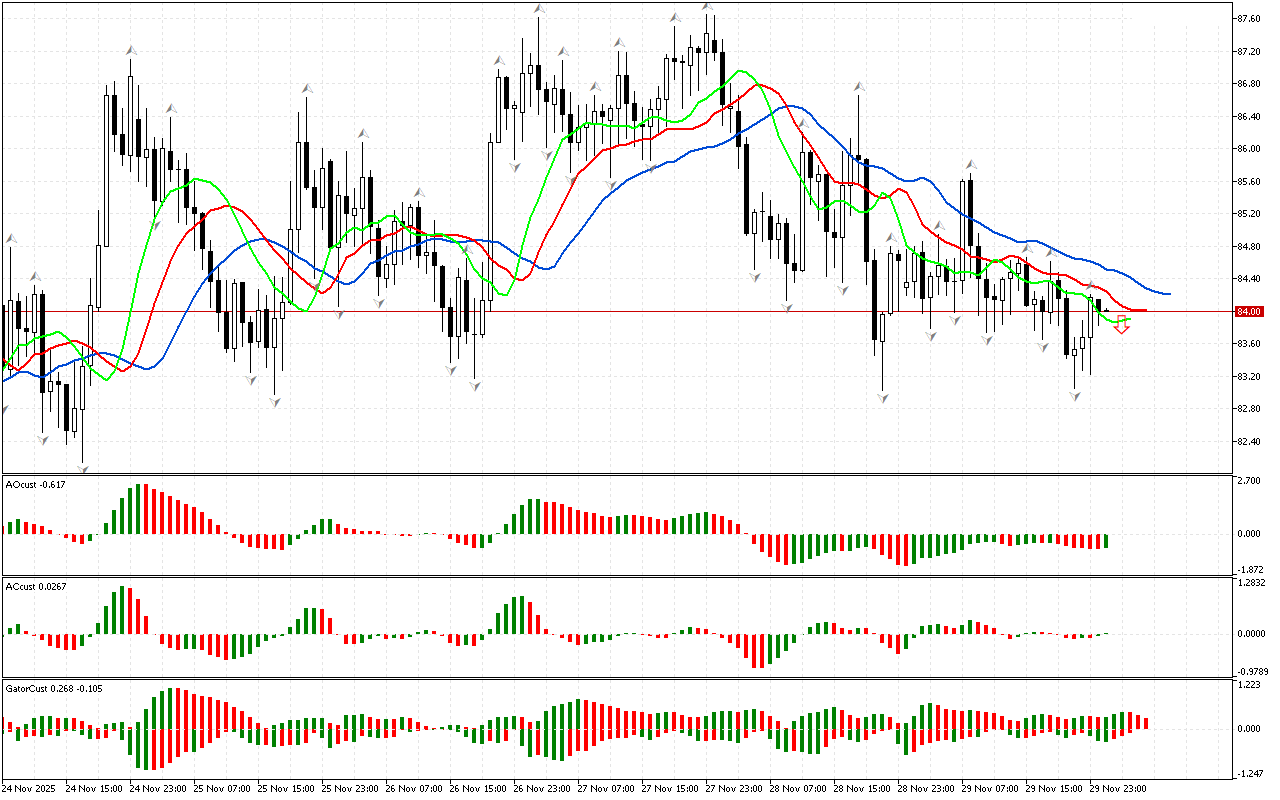
Bit.Cash H1: The Chaos Theory Forecast for the American Session on 29.11.2025
Leave a Reply