
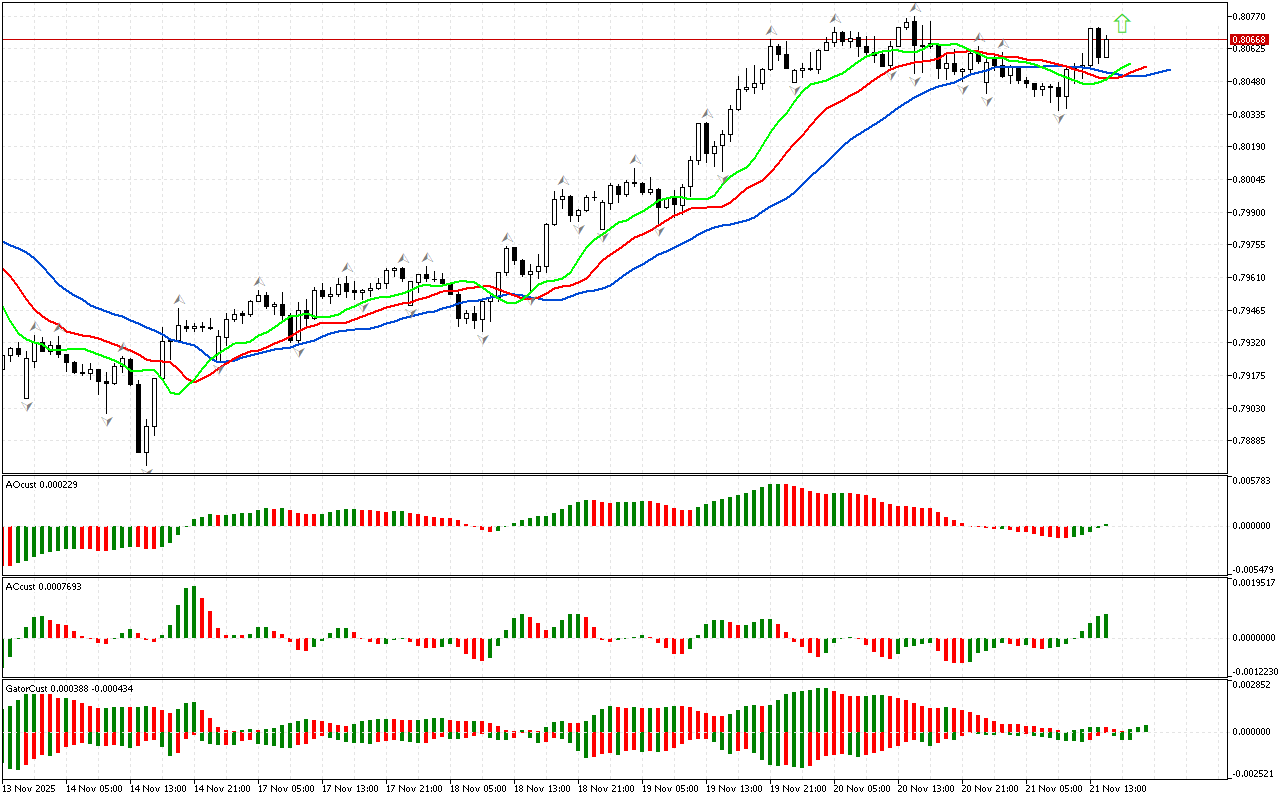
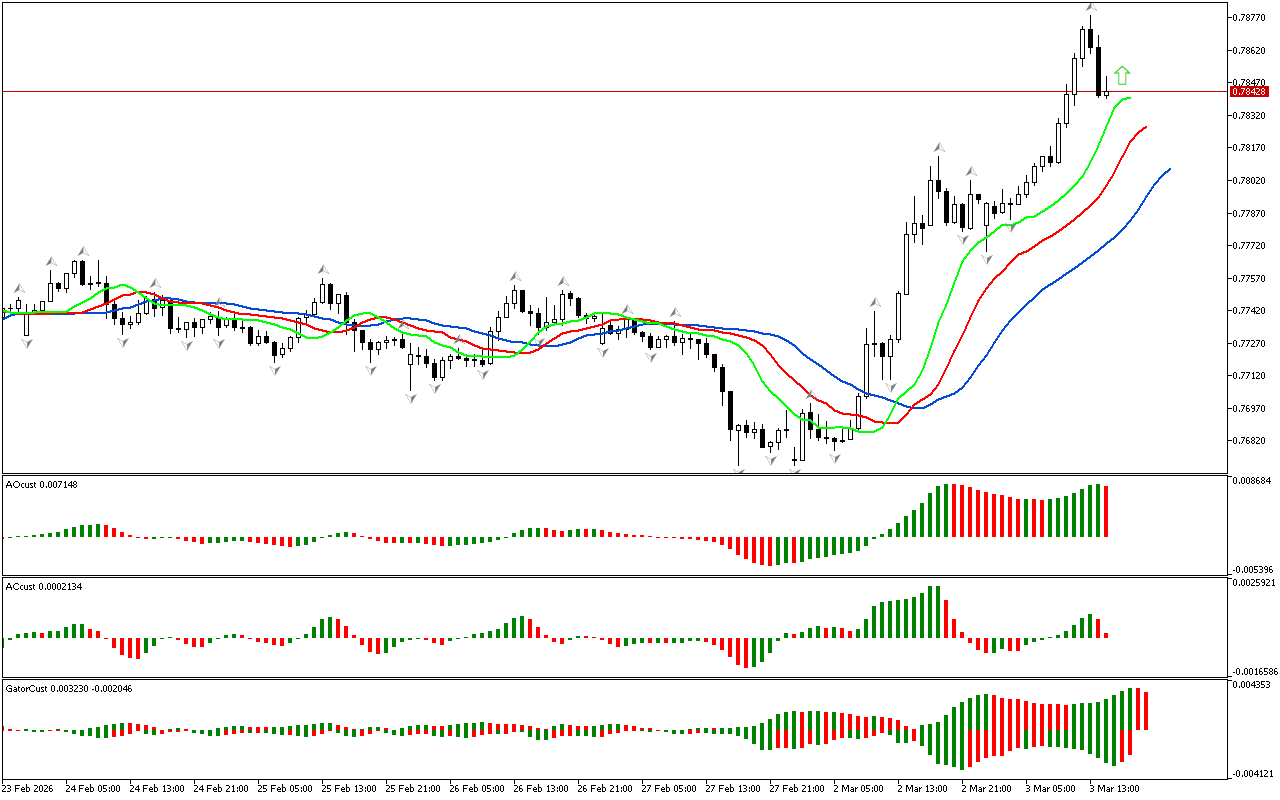
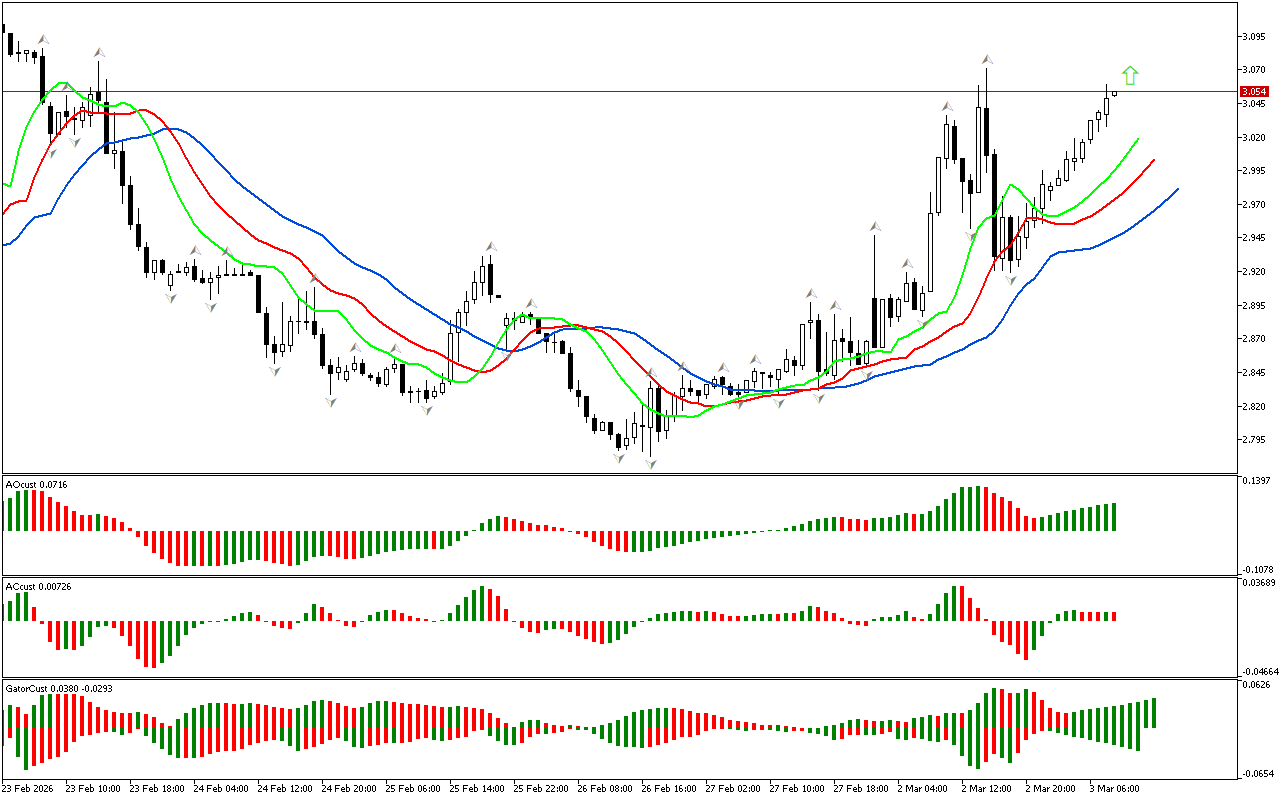
Traditionally, the review begins with examination of the first market dimension. The price has risen above the upper fractal. This defines the phase space as northern. This signal indicates the possible development of an upward movement. To assess its strength and energy, let’s consider other market dimensions within the framework of Bill Williams’ strategy.
The Awesome Oscillator indicator has consolidated below the zero mark.
On the Accelerator Oscillator indicator, the last bars are colored green and located above the zero line. This is a sign that the market has enough energy to continue the movement in northern direction.
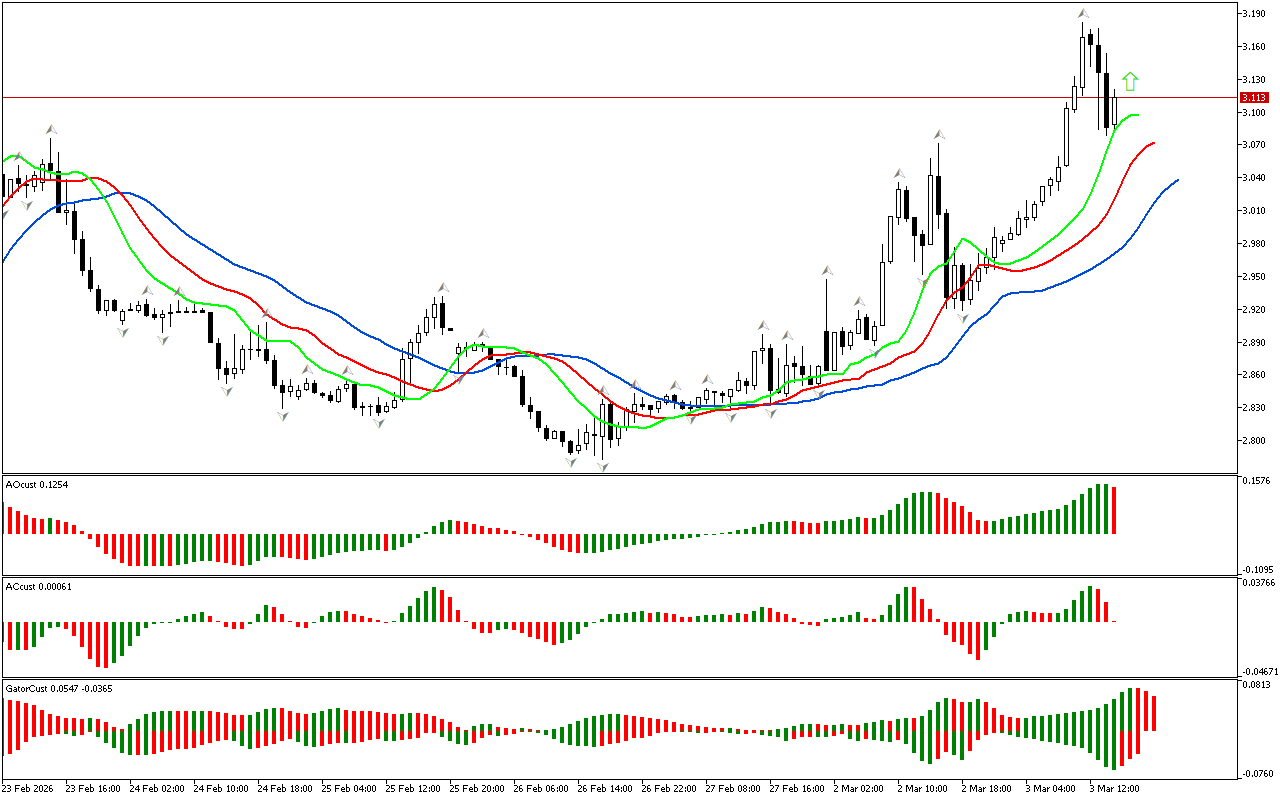
As it is seen, the AC and AO indicators are in the green zone, which indicates that there is enough strength and energy to continue the movement in the northern direction.
The last formed bar on the AO, AC and Gator indicators is colored green. This signal may indicate a strengthening of positive market sentiment. Traders may consider this as a confirmation of the current upward movement and weigh options to open or increase long positions.
The histogram of the Gator indicator has not formed a clear signal yet. The color of the histograms changes, indicating a change in market phase.
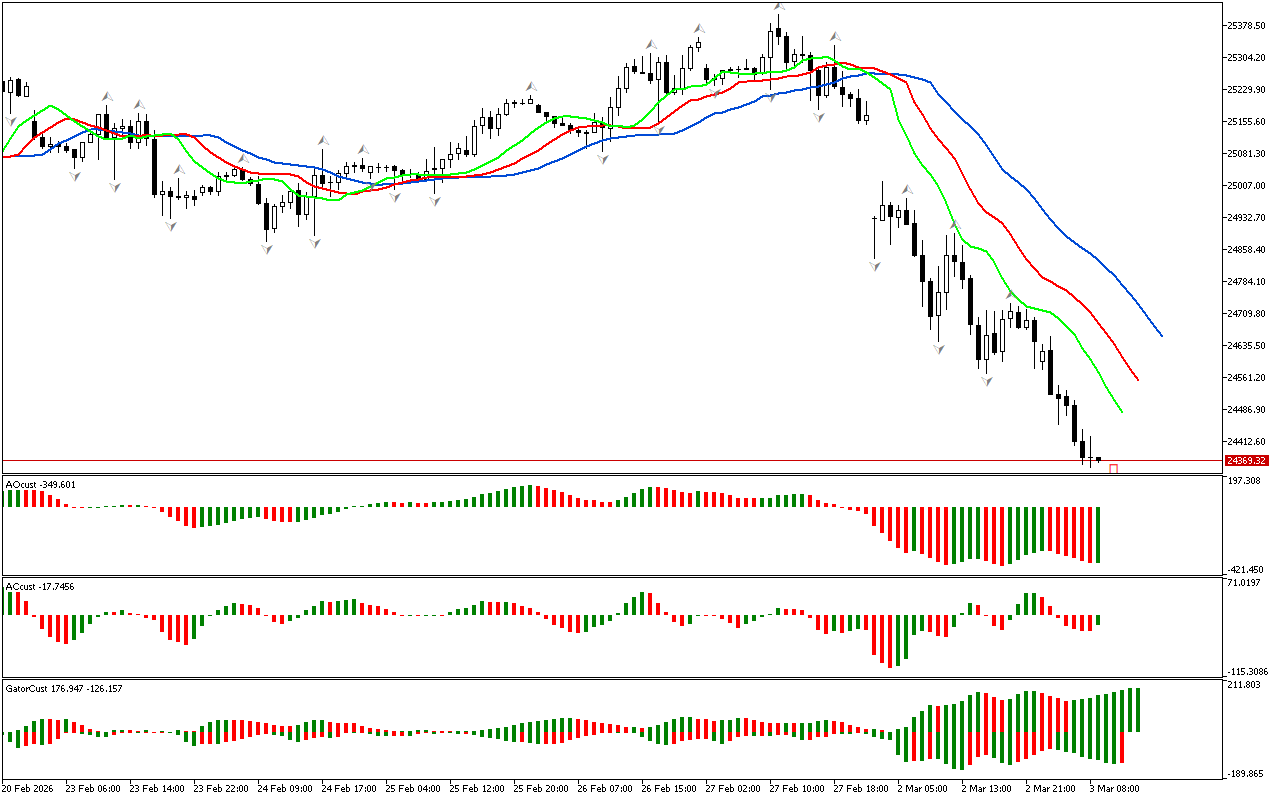
As a result, there is a northern phase space. At the same time, some indicators indicate the possible development of a pullback movement or the transition of the market to a new phase.
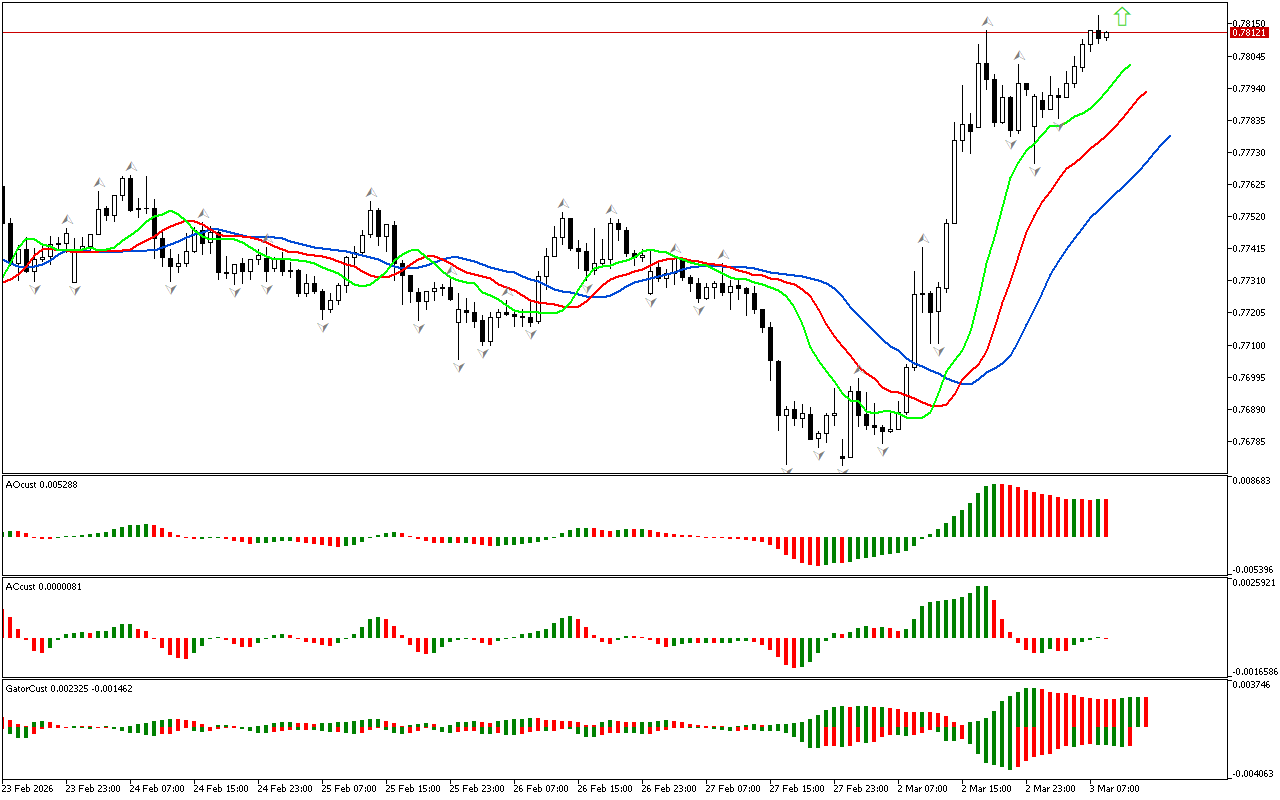
📊 Buy Stop 0.80719
❌ Stop Loss 0.80602
After entering the market, Stop Loss is carried along the red line after the closing of each candle. The profit is fixed by moving Stop Loss, or when opposite signals appear on the AO, AC, Gator indicators.
Leave a Reply