
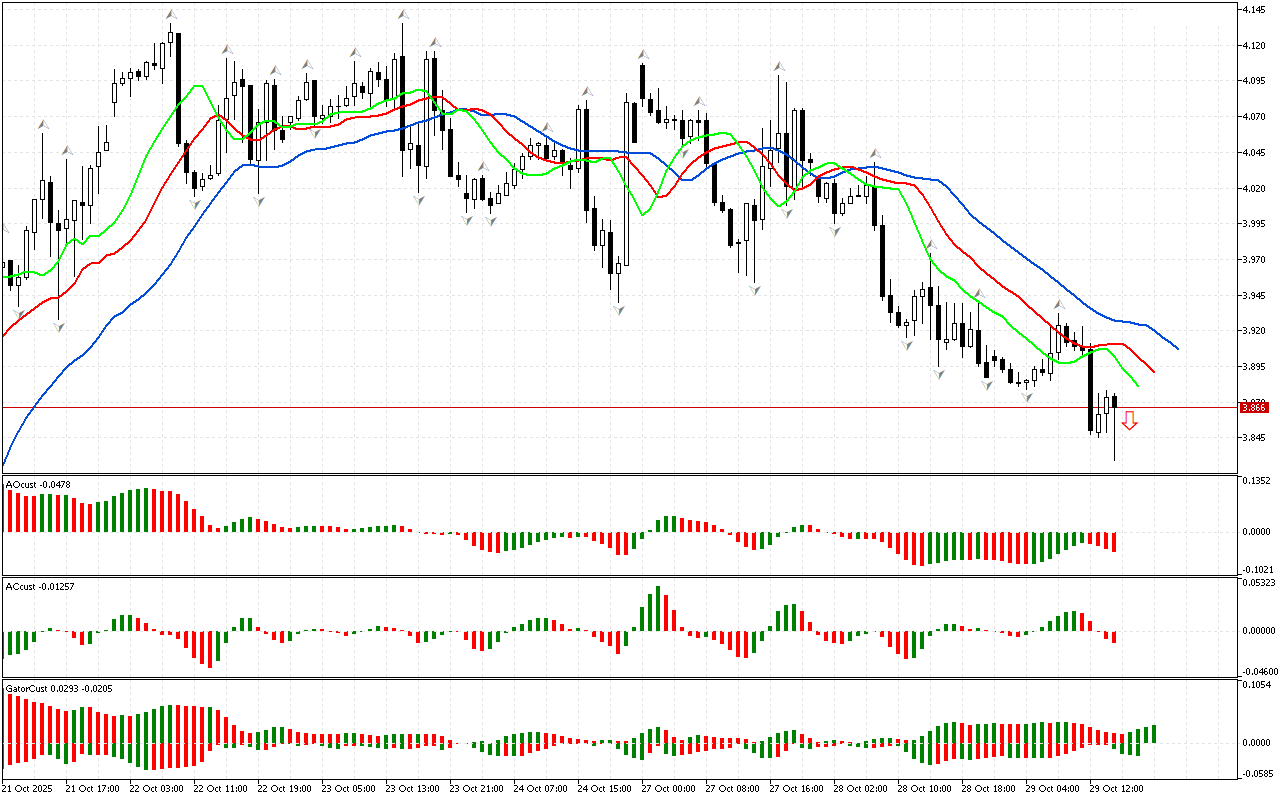
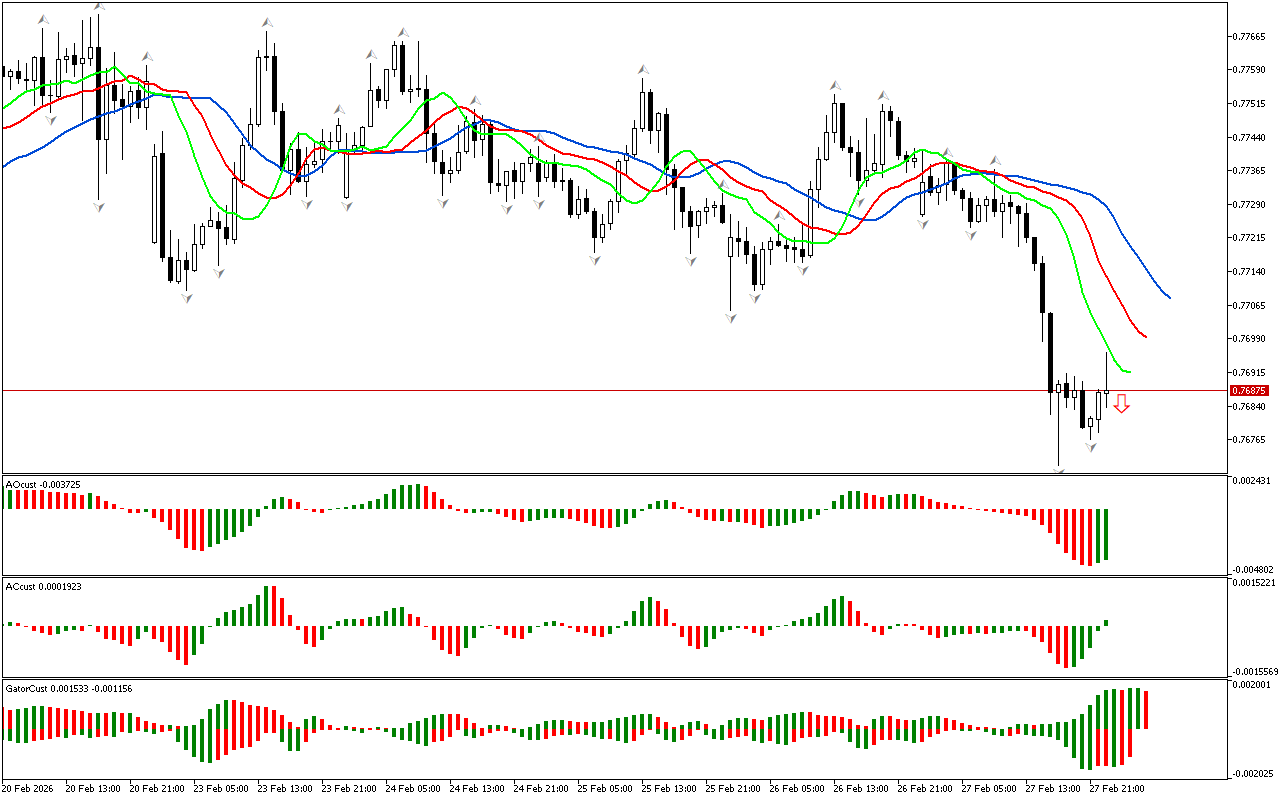
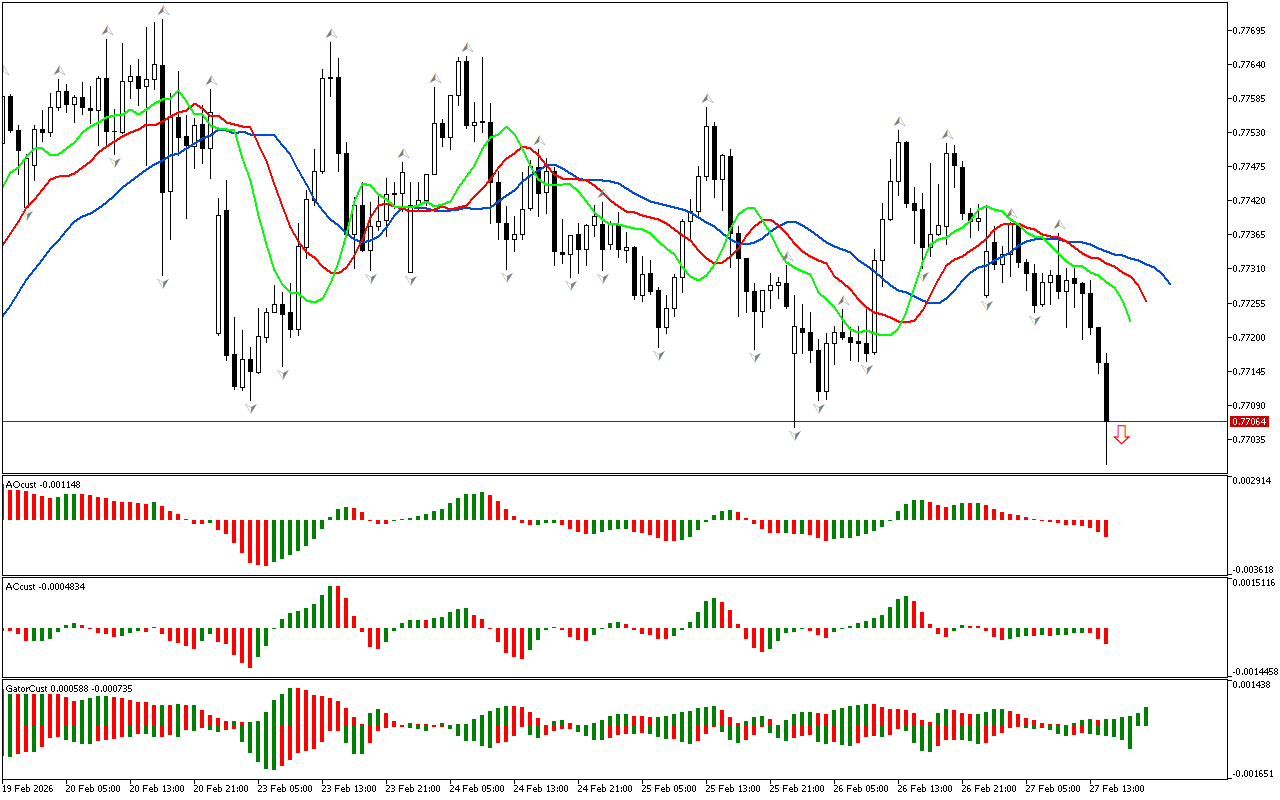
The analysis of the current market situation shows that the phase space is defined as southern. The price has fallen below the lower fractal. This may indicate the beginning of a downward movement. To gain the information about the strength and energy of this movement, let’s pay attention to the positions of other indicators on the chart.
The alligator is active and ready to hunt: its lines laid in a typical for the development of a downward movement order.
At the same time, the AO indicator remains in the negative zone.
The two red bars located below the zero line on the Accelerator Oscillator indicator show an increase in energy in the southern phase of the market.
Signals from the AC and AO indicators indicate that the market has sufficient strength and energy to reduce the price further.
Several green columns in a row have been formed on the Gator indicator. This indicates that the Alligator is hungry and its appetite is increasing.
As an epilogue to the analysis, the southern direction of price movement is noted to be considered as a priority. At the same time, the indicators contain signals about the possible development of a correction, which should be used to search for entry points at more beneficial prices.
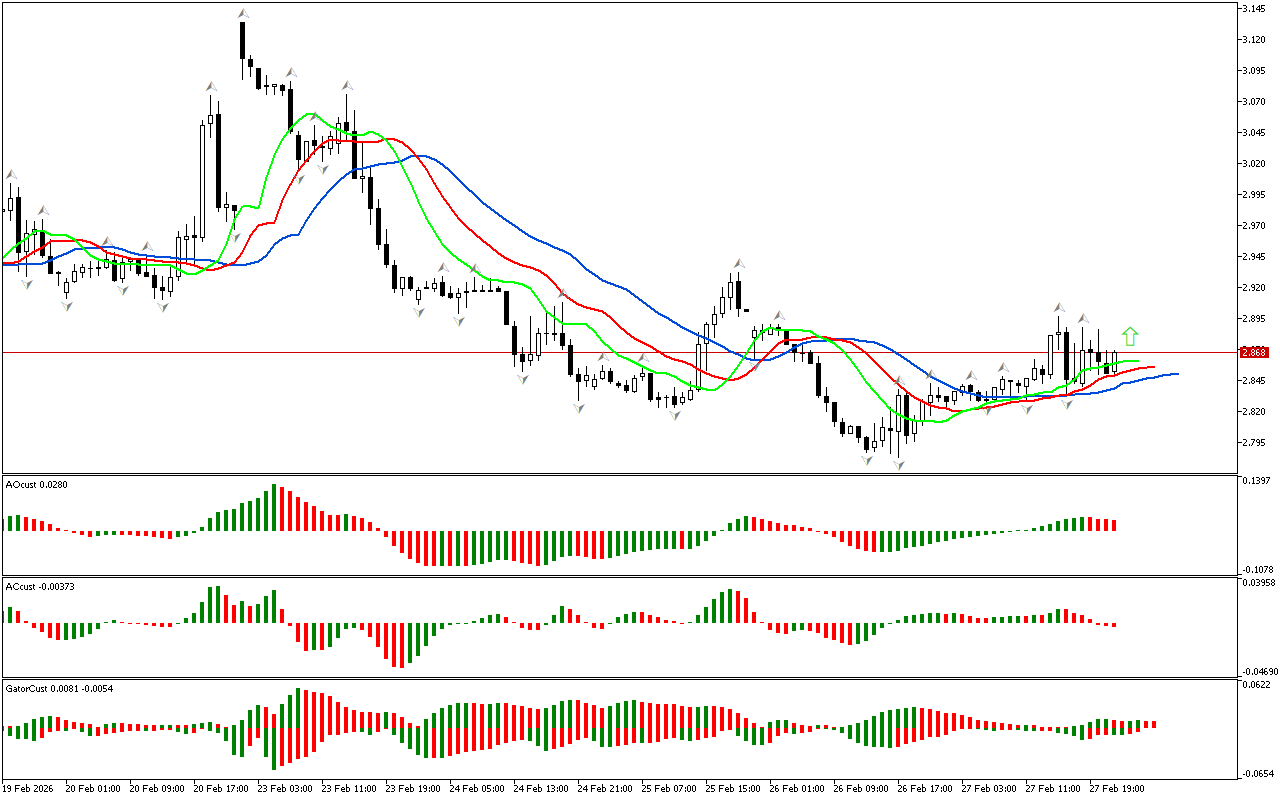
📊 Sell Stop 3.829
❌ Stop Loss 3.932
After entering the market, Stop Loss is moved along the red line after closing each candle. The profit is fixed by moving Stop Loss, or when opposite signals appear on the AO, AC, Gator indicators.
Natural Gas H1: The Chaos Theory Forecast for the American Session on 29.10.2025
Leave a Reply