
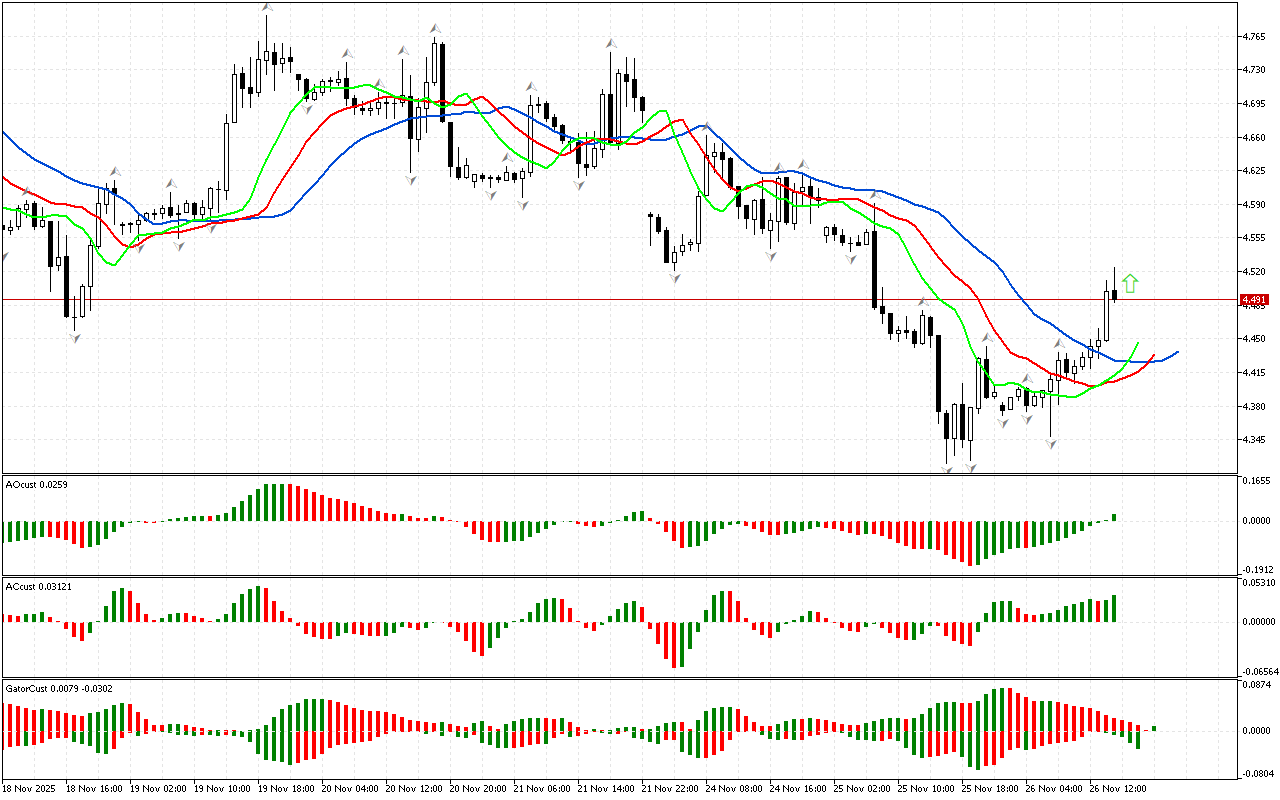
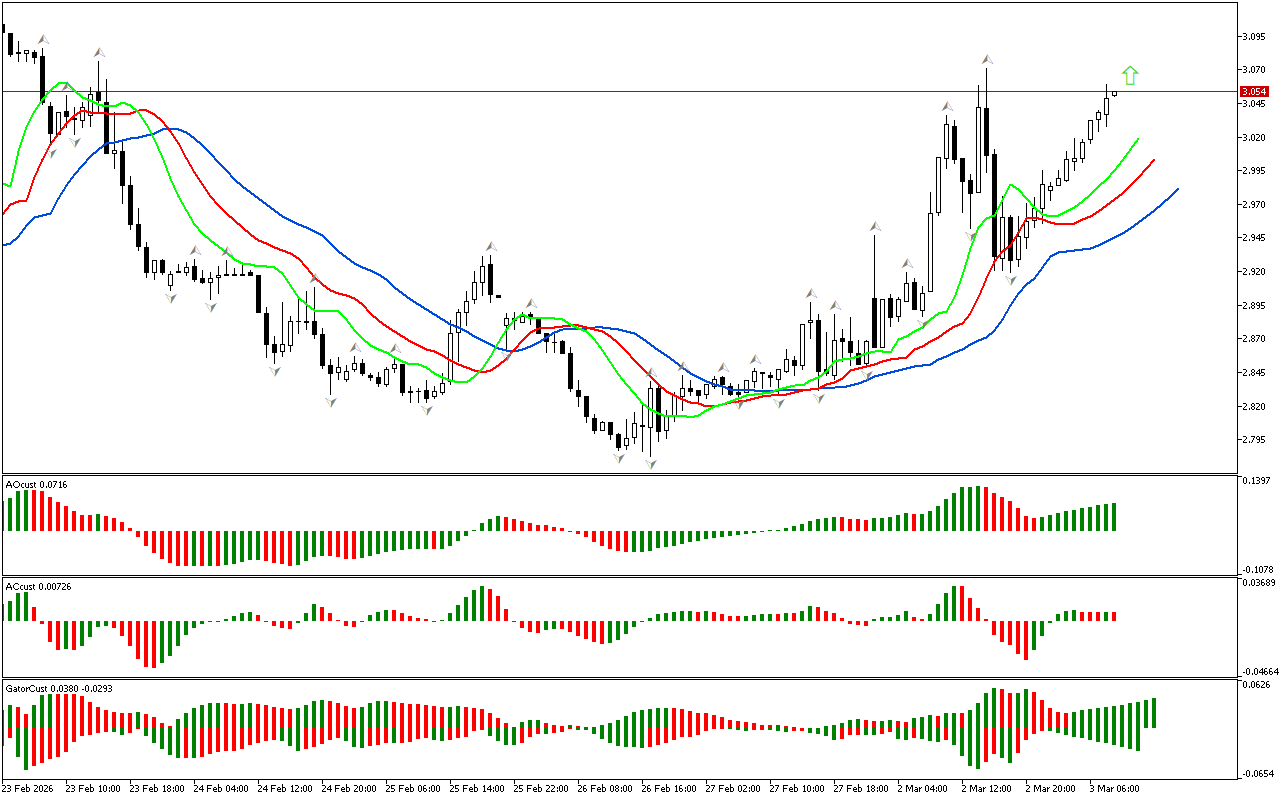
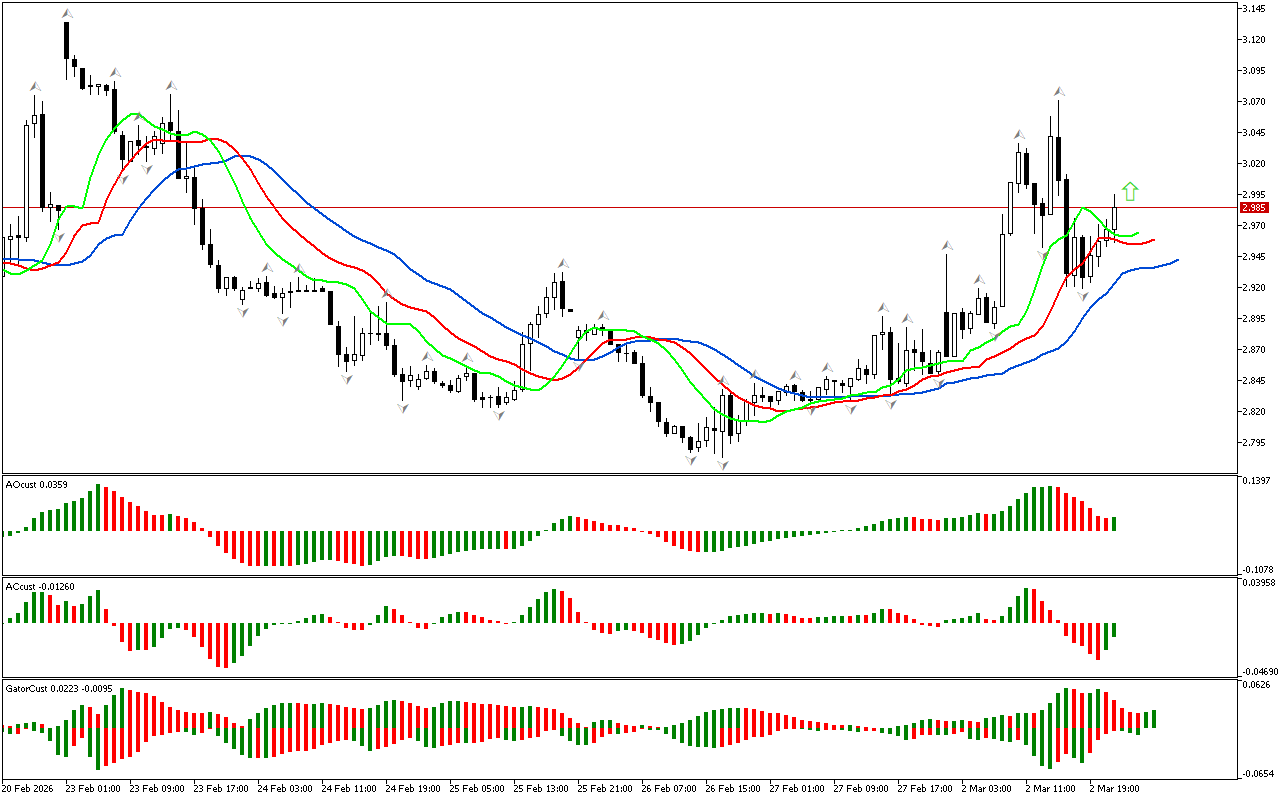
First of all, let’s examine the first market dimension which is a key point in determination the further strategy of behavior of a trader or investor within the framework of Bill Williams’ strategy. The price has risen above the upper fractal on the current chart. This defines the phase space as northern. It may indicate the formation of an upward movement. To assess its potential, the signals from other market dimensions should be examined.
Despite the fact that the phase space is defined as northern, the trend of the Alligator lines is horizontal. This does not replace the previous signal, but indicates continued uncertainty in the market because the Alligator is sleeping.
There is a series of the green bars on the AO indicator. The indicator crosses above the zero mark. This signals that there is a strength to continue the movement in the northern direction.
In general, the signals from the AC and AO indicators show that there is sufficient strength and energy in the market to continue the upward movement.
The color of the histograms of the Gator indicator changes, so this indicator has not formed a clear signal yet.
Let’s summarize. The phase space is determined to be northern after the price has risen above the upper fractal. Signals from other indicators strengthen this signal and prove the prevalence of the upward vector of price movement.
📊 Buy Stop 4.524
❌ Stop Loss 4.418
After entering the market, Stop Loss is carried along the red line after the closing of each candle. The profit is fixed by moving Stop Loss, or when opposite signals appear on the AO, AC, Gator indicators.
Natural Gas H1: The Chaos Theory Forecast for the American Session on 26.11.2025
Leave a Reply