
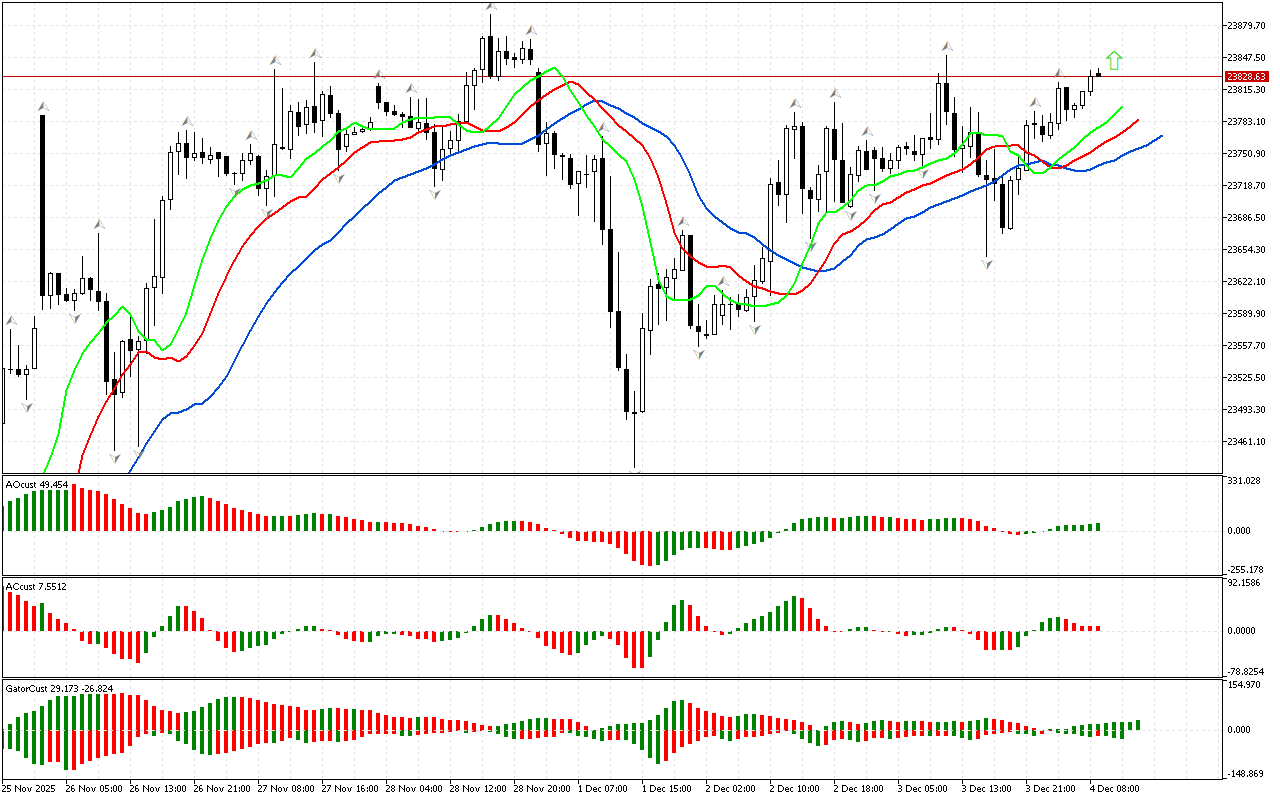
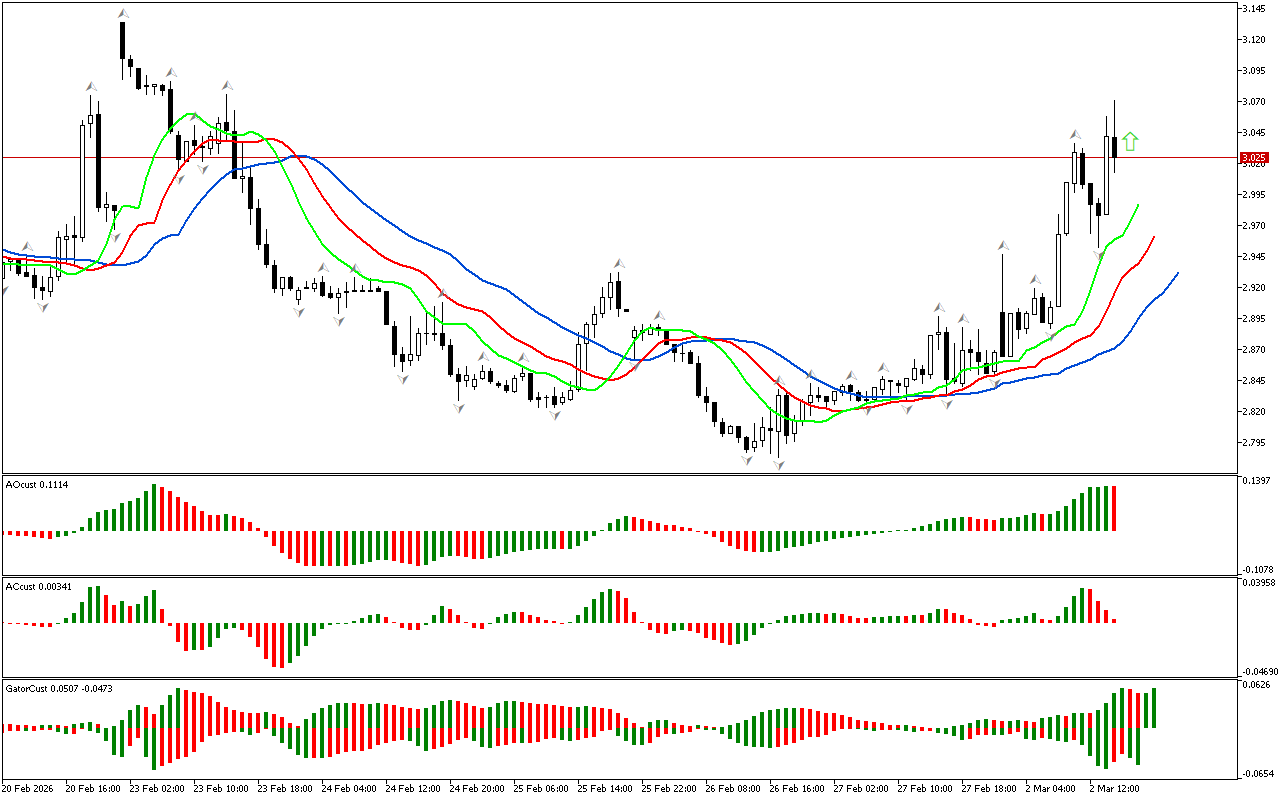
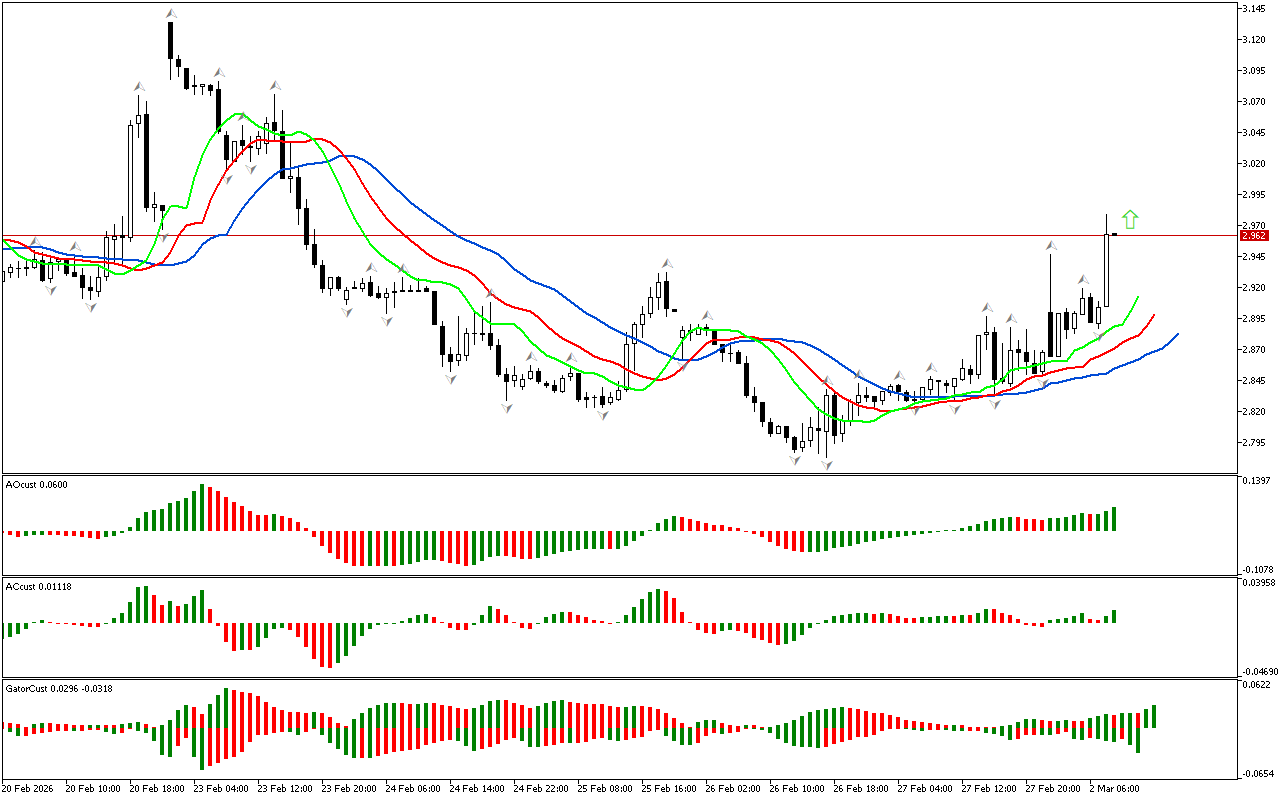
The price has risen above the upper fractal located above the Alligator’s mouth on the chart. Due to this signal, we define the phase space as a northern one and can examine the following 3 dimensions of the market.
The Alligator indicator confirms the positive market sentiment. The Alligator’s mouth is open. It’s hungry. Against this background, the price may continue to rise.
The AO indicator is still above the zero mark.
On the AC indicator there is a series of red bars above the zero line. This is a negative signal for the market. It indicates a decrease in the energy of movement in the northern direction. However, the upward movement remains prevalent as long as the price remains above the red Alligator line.
A series of green bars is drawn in the Gator indicator. This shows the Alligator’s gluttony. The Hungry Alligator period is the time when a trend movement develops in the market.
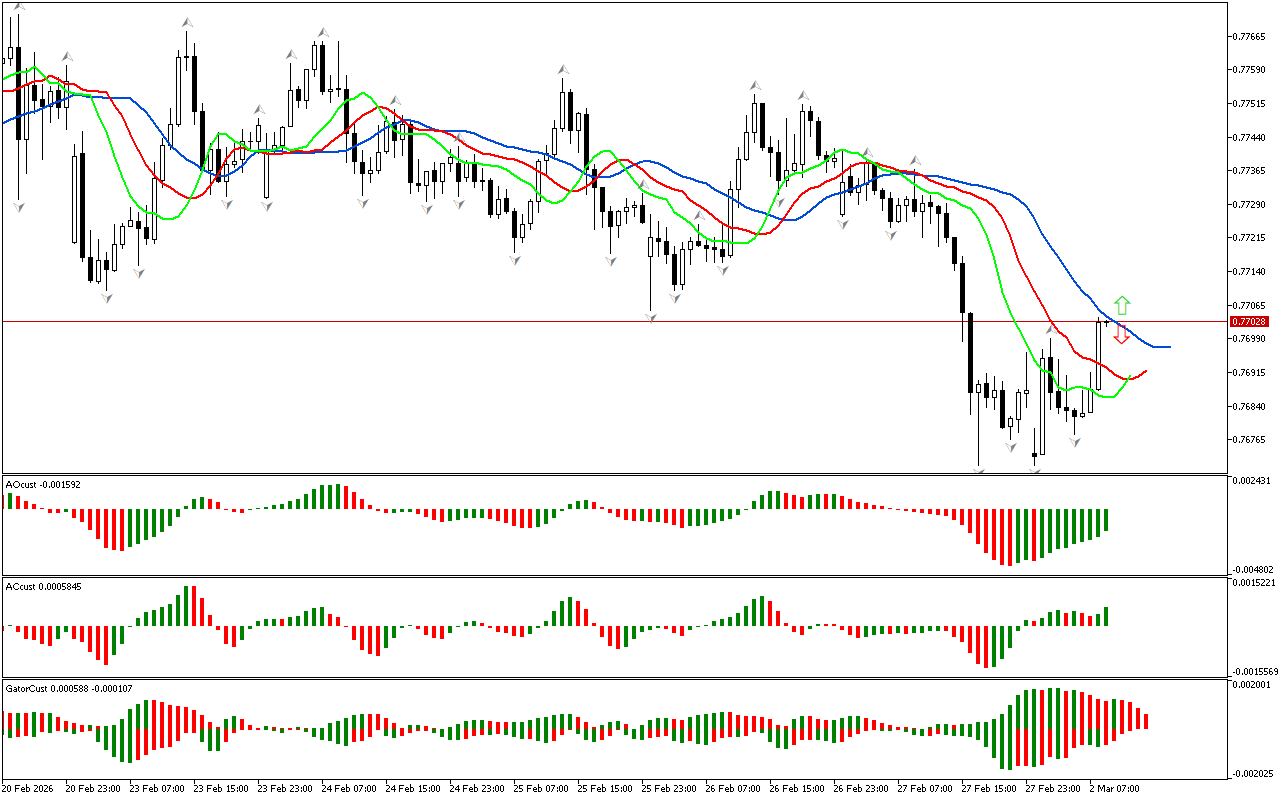
As a result, there is a northern phase space. At the same time, some indicators indicate the possible development of a pullback movement or the transition of the market to a new phase.
📊 Buy Stop 23836.13
❌ Stop Loss 23739.89
After entering the market, Stop Loss is carried along the red line after the closing of each candle. The profit is fixed by moving Stop Loss, or when opposite signals appear on the AO, AC, Gator indicators.
DAX 40 H1: The Chaos Theory Forecast for the European Session at 4.12.2025
Leave a Reply