
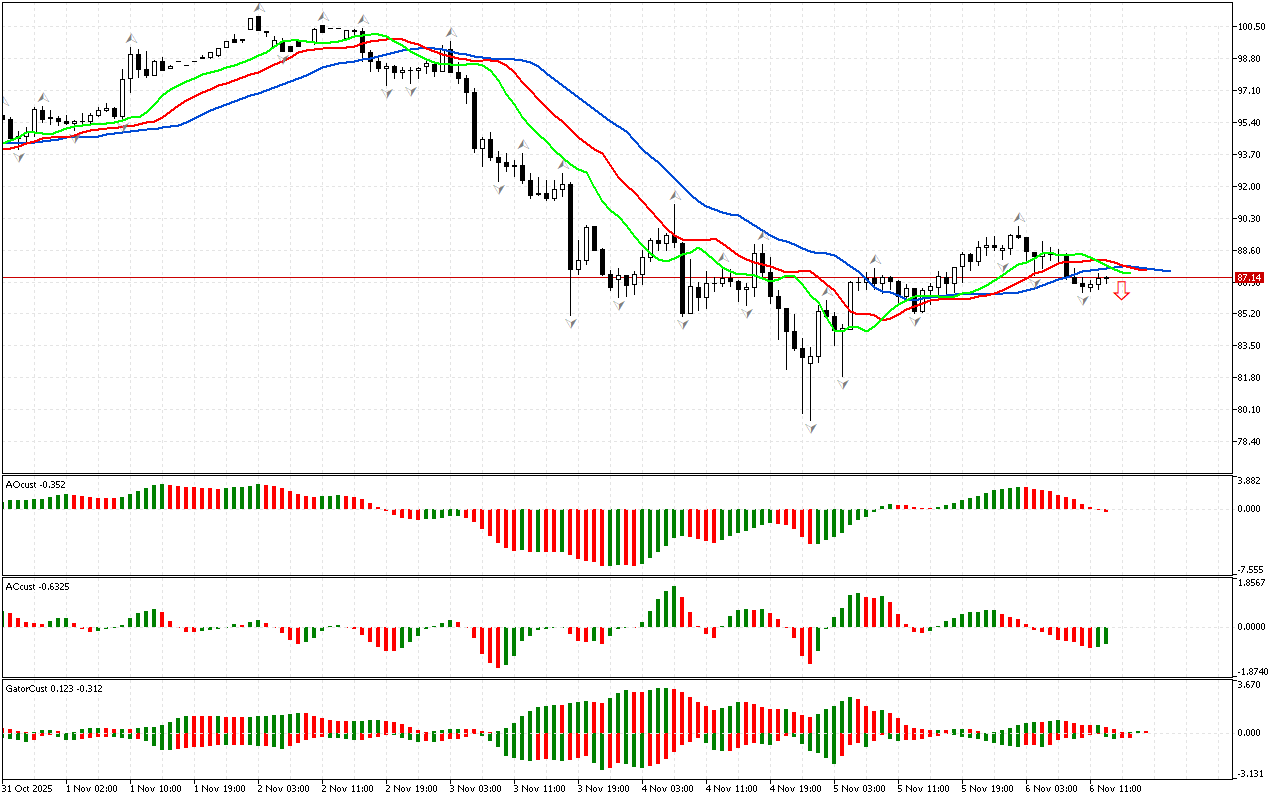
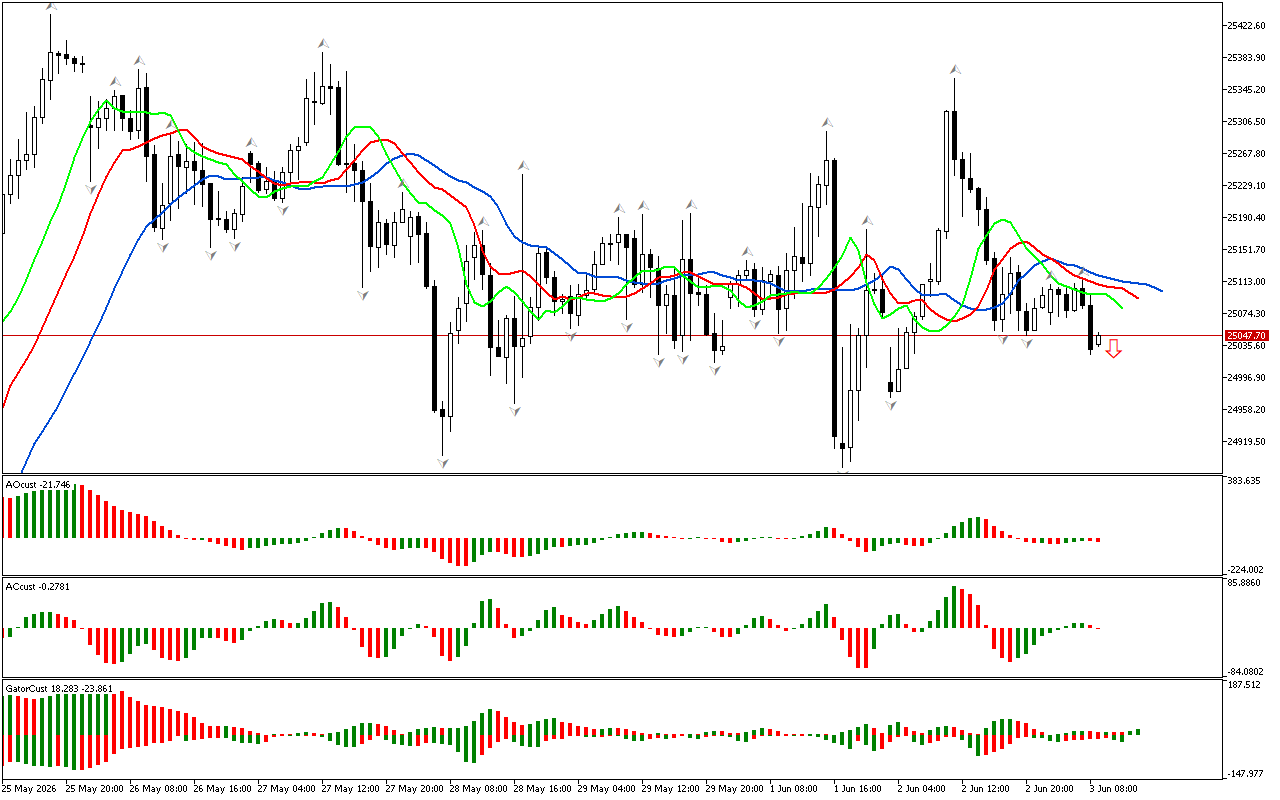
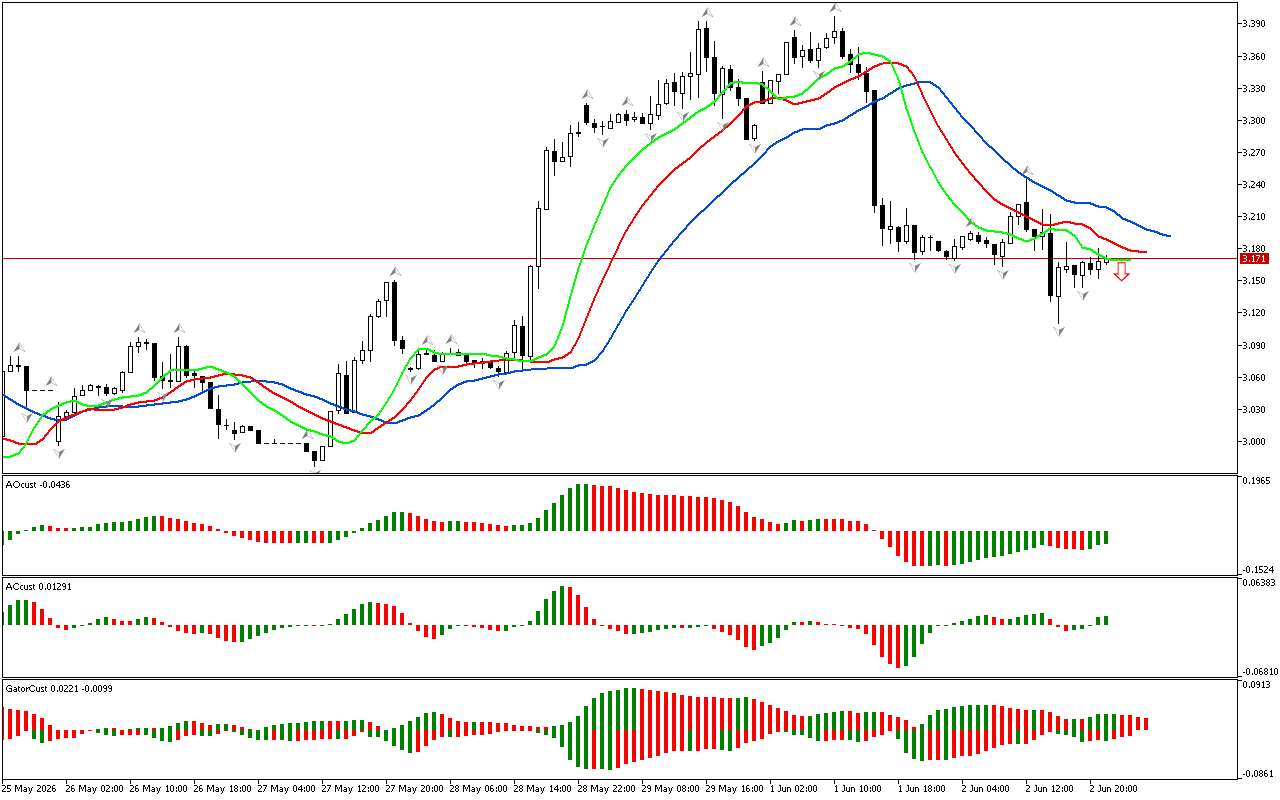
The review begins with the analysis of the first dimension of the market. The price has fallen below the lower fractal, located outside the Alligator’s mouth. Therefore, the phase space is defined as southern. The most probable price change dynamics are a price decrease. To assess the strength and energy of this movement, let’s consider other dimensions of the market, according to the strategy of Bill Williams.
The Awesome Oscillator indicator crossed the zero line from top to bottom. This signal indicates that there is strength to continue the movement in the southern direction.
The histogram of the Gator indicator has not formed a clear signal yet. The color of the histograms changes, indicating a change in market phase.
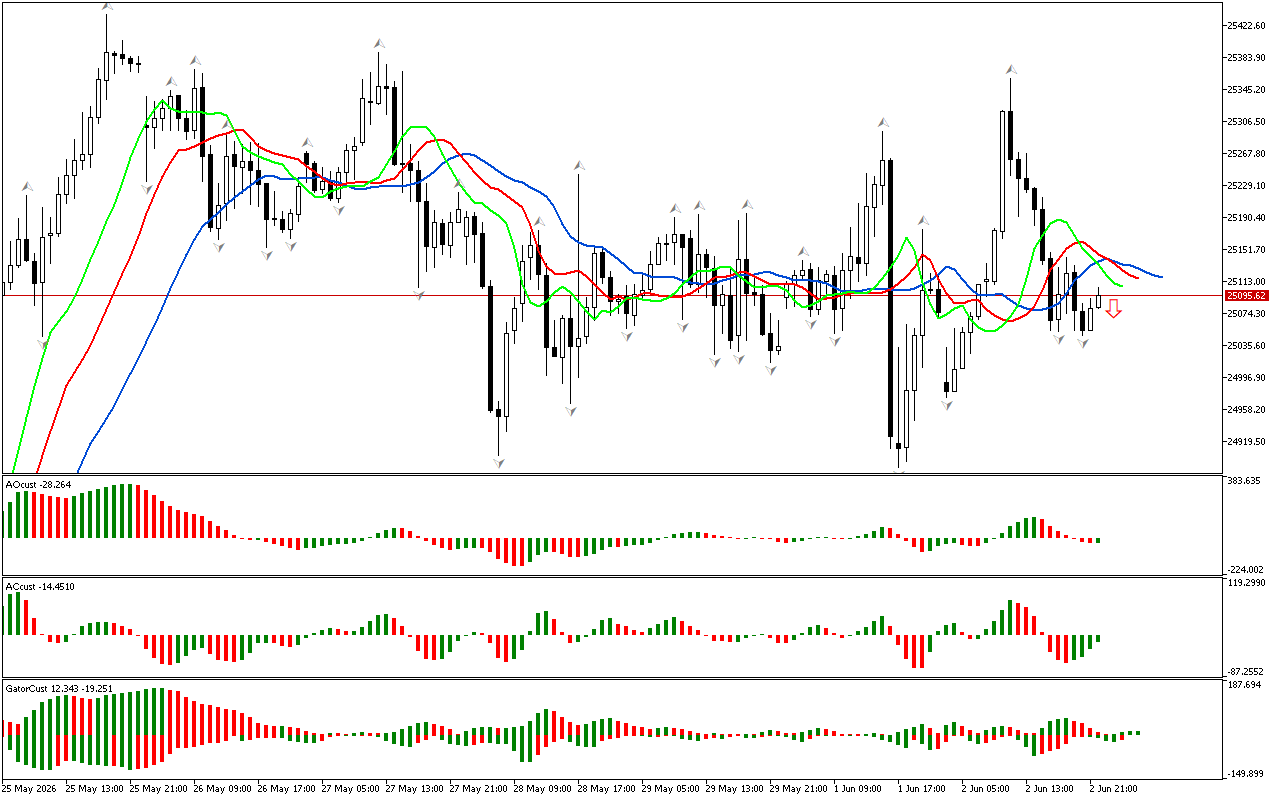
As an epilogue to the analysis, the southern direction of price movement is noted to be considered as a priority. At the same time, the indicators contain signals about the possible development of a correction, which should be used to search for entry points at more beneficial prices.
📊 Sell Stop 86.36
❌ Stop Loss 87.86
After entering the market, Stop Loss is moved along the red line after closing each candle. The profit is fixed by moving Stop Loss, or when opposite signals appear on the AO, AC, Gator indicators.
Leave a Reply