
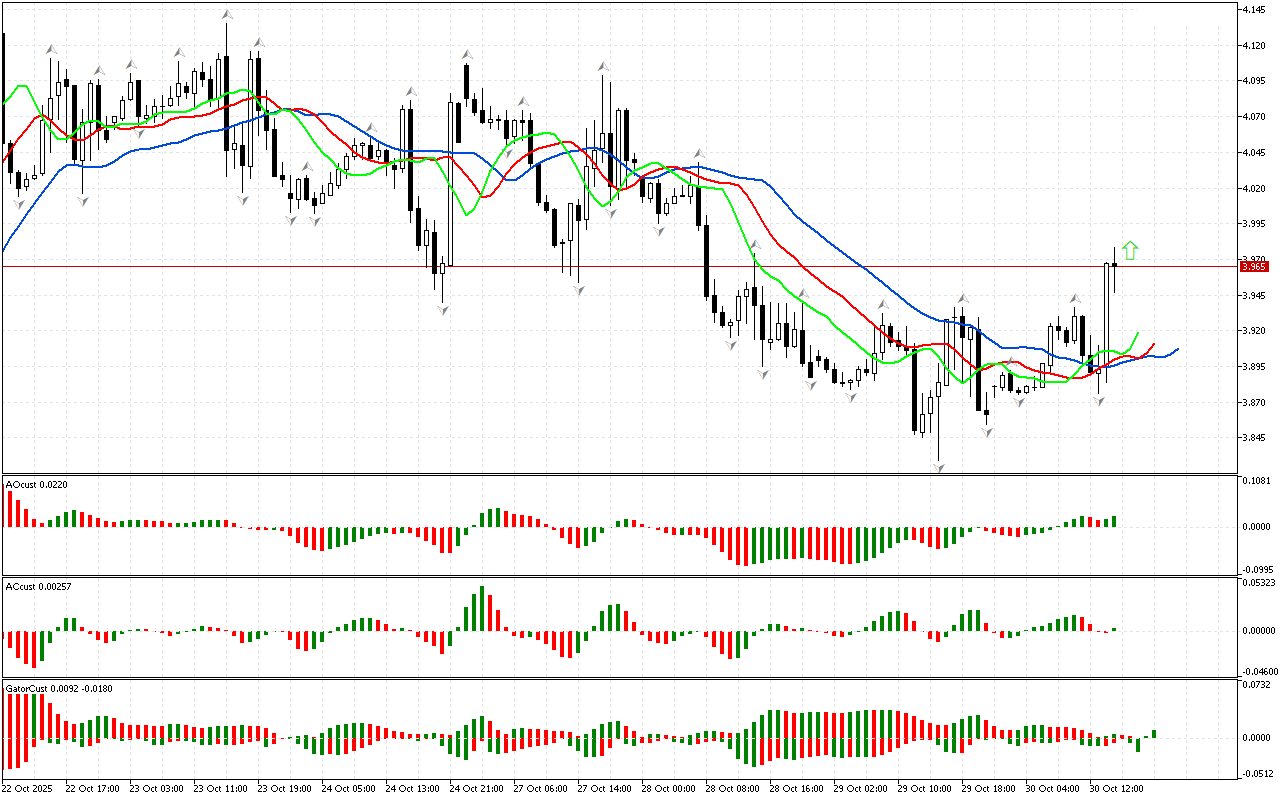
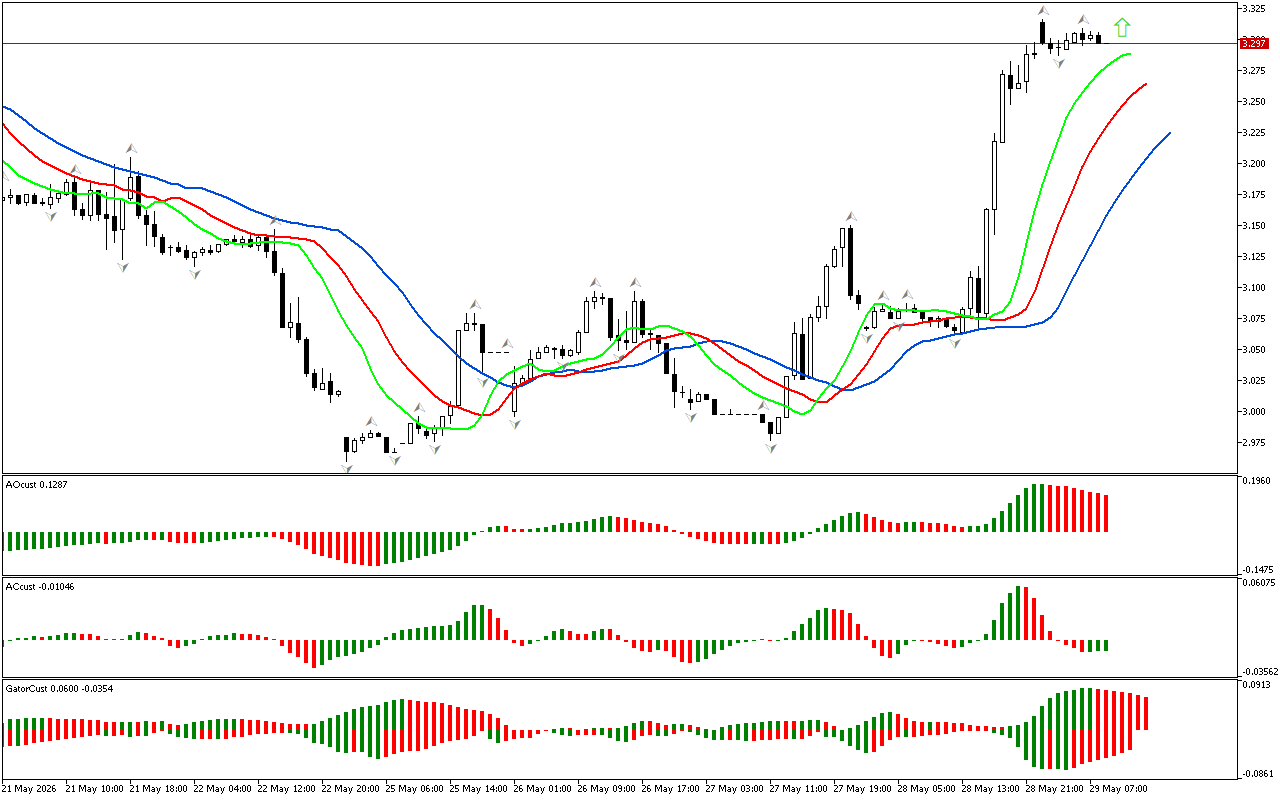
An analysis of the first phase of the market begins the review. The price is noted to have risen above the upper fractal on the chart. It determines the direction of the phase as northern. This signal indicates the possible start of an upward movement.
The Alligator indicator confirms the positive market sentiment. The Alligator’s mouth is open. It’s hungry. Against this background, the price may continue to rise.
The Saucer signal has appeared on the Awesome Oscillator indicator. This signal indicates a possible change in the direction of the market movement to upward. As Bill Williams notes, the Saucer signal is one of the strong AO indicator’s signals and can be used to determine when to enter or exit the market. Traders may be considering opening a position up. This signal can be strengthened by other indicators.
There are two red bars below the zero line on the AC indicator. This signal’s worth paying attention to. It shows a decrease in energy of movement to the northern direction. However, the upward movement is prevalent as long as the price remains above the red Alligator line. After a correction is finished, the price may resume its downward movement.
The histogram of the Gator indicator has not formed a clear signal yet. The color of the histograms changes, indicating a change in market phase.
As a result, there is a northern phase space. At the same time, some indicators indicate the possible development of a pullback movement or the transition of the market to a new phase.
📊 Buy Stop 3.978
❌ Stop Loss 3.892
After entering the market, Stop Loss is carried along the red line after the closing of each candle. The profit is fixed by moving Stop Loss, or when opposite signals appear on the AO, AC, Gator indicators.
Natural Gas H1: The Chaos Theory Forecast for the American Session on 30.10.2025


Leave a Reply