

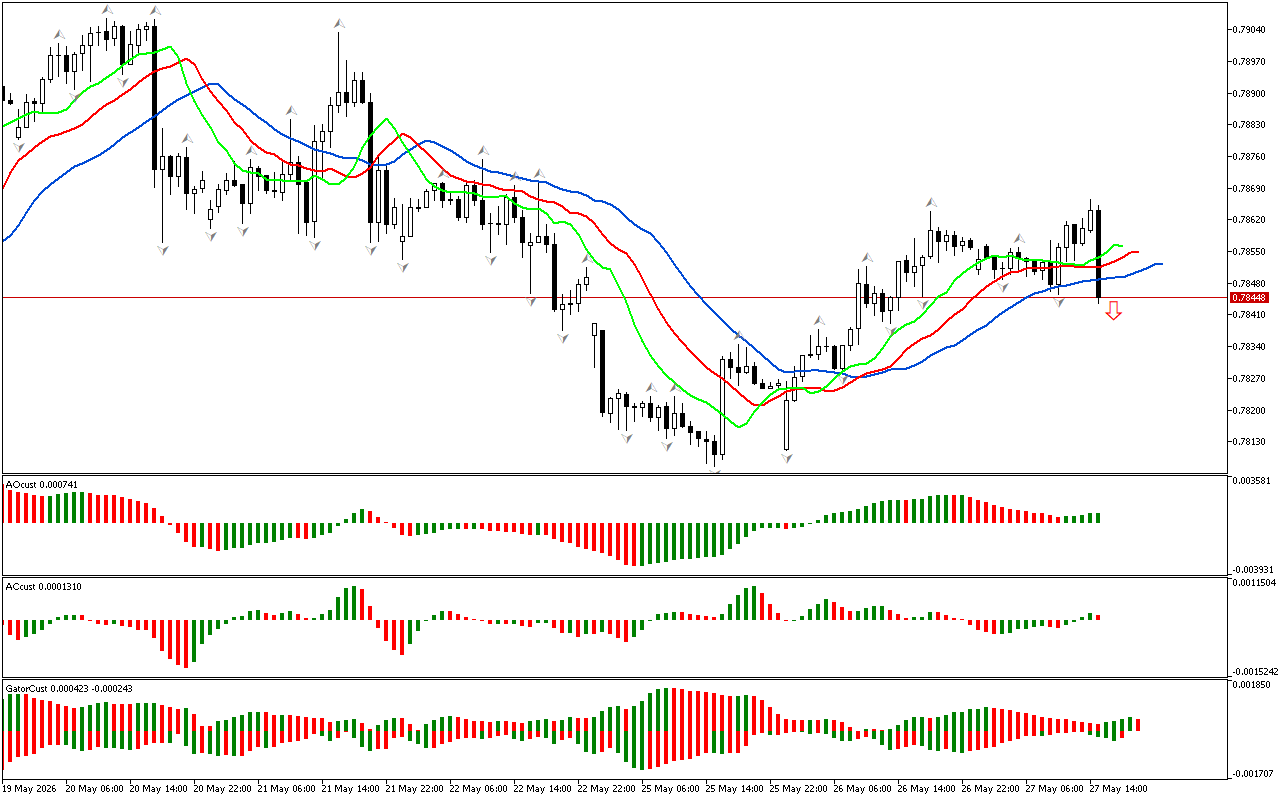
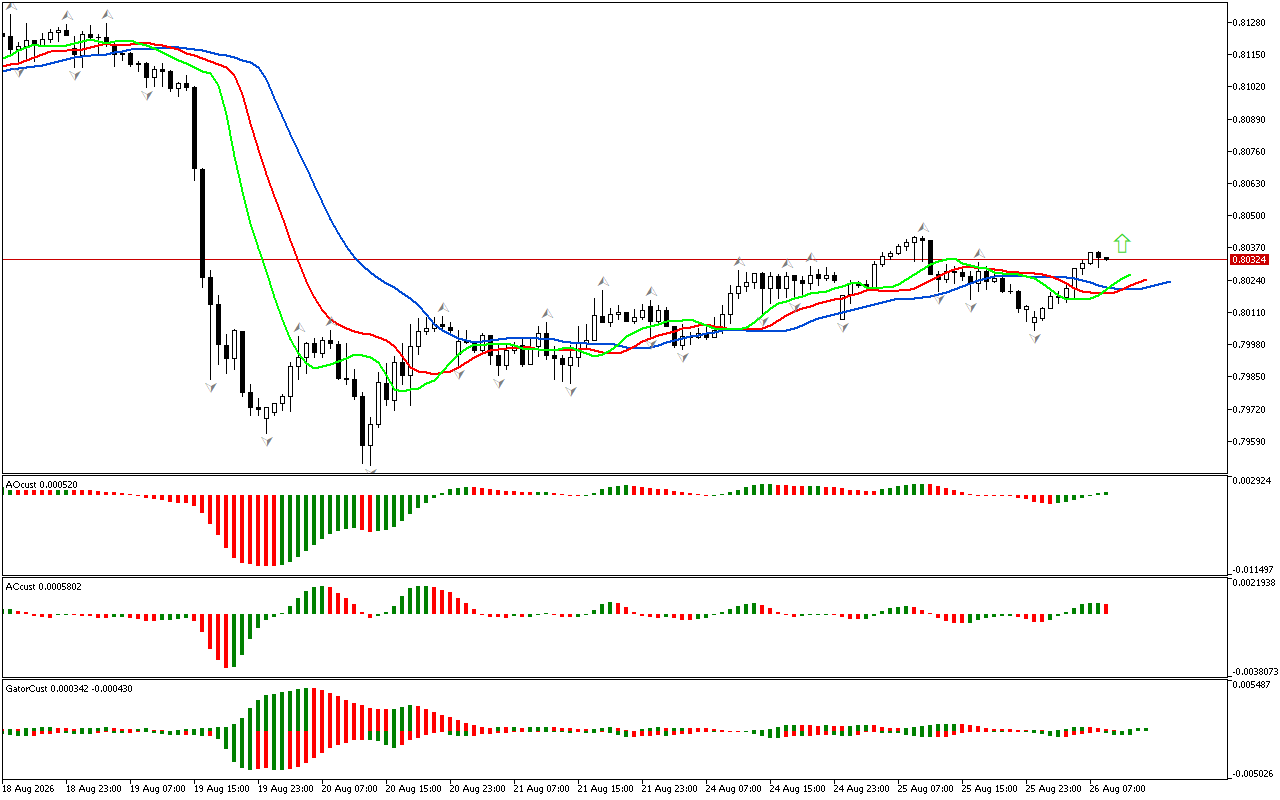
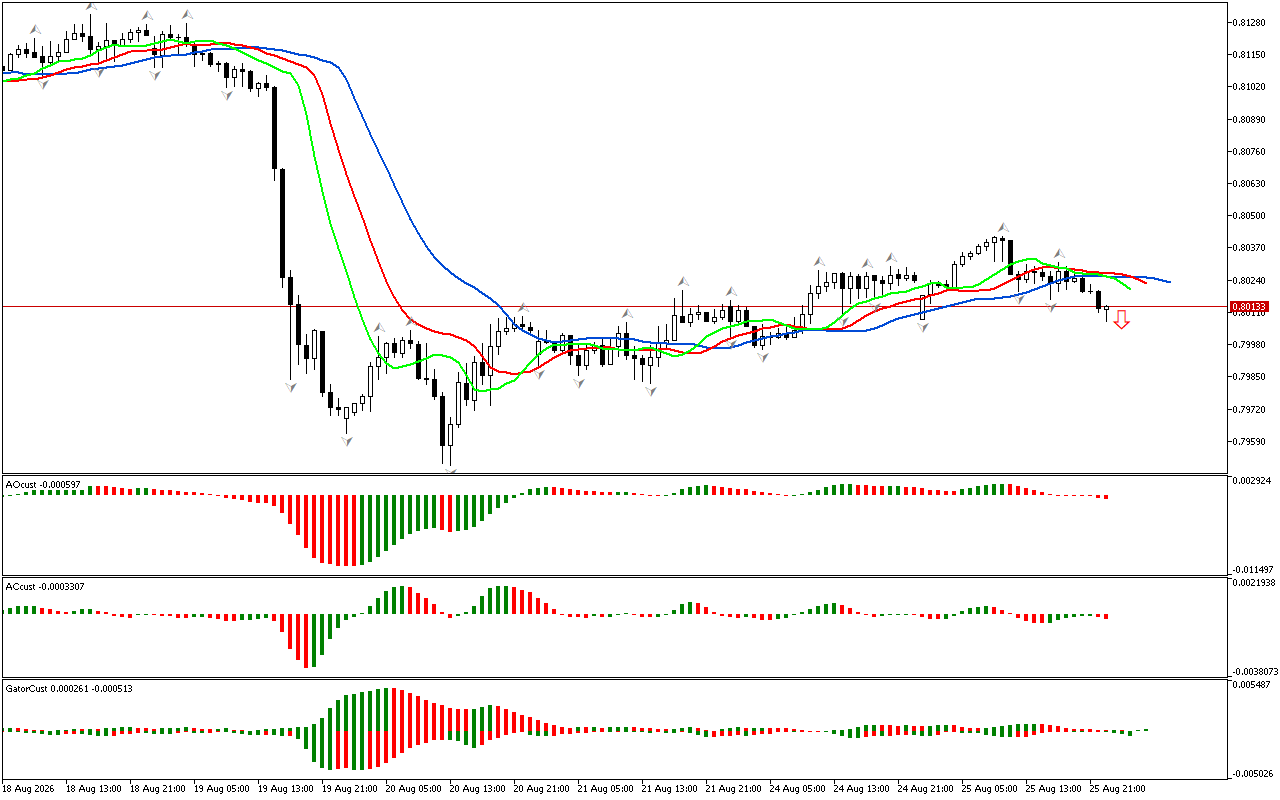
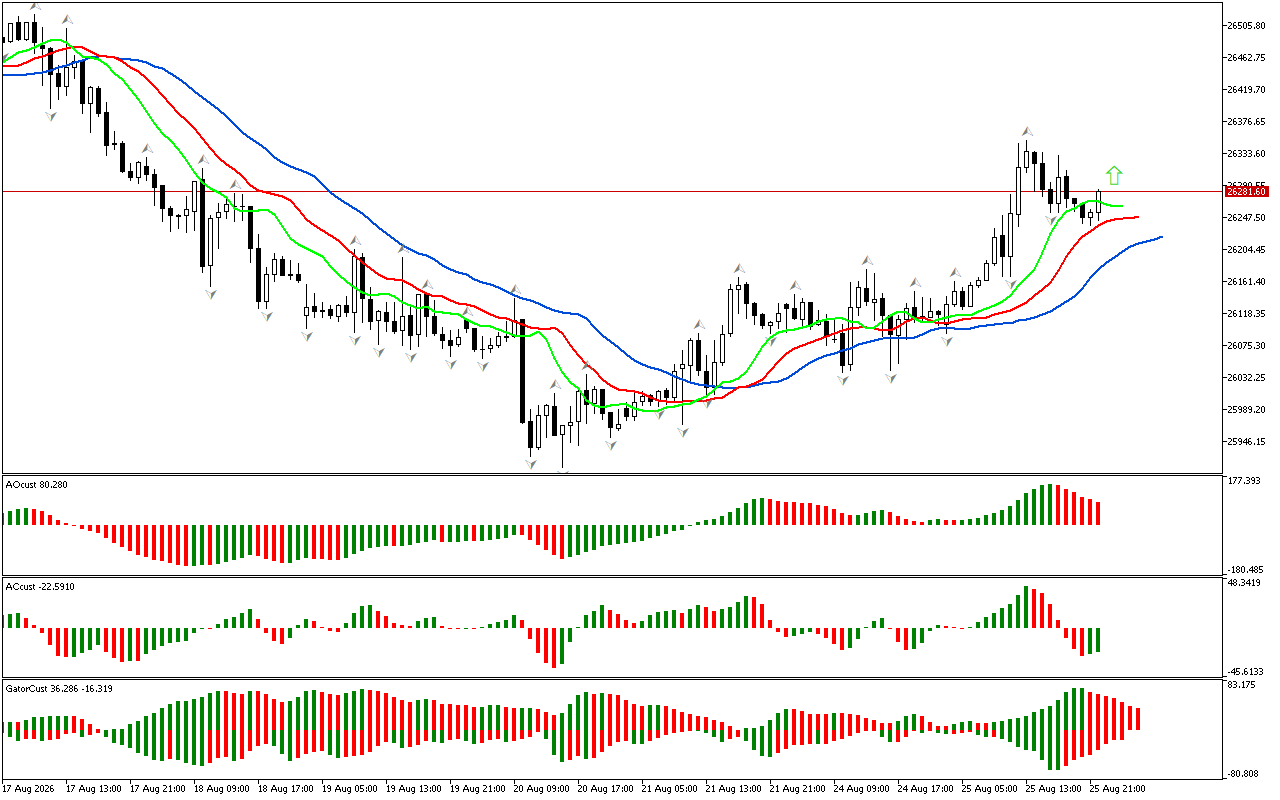
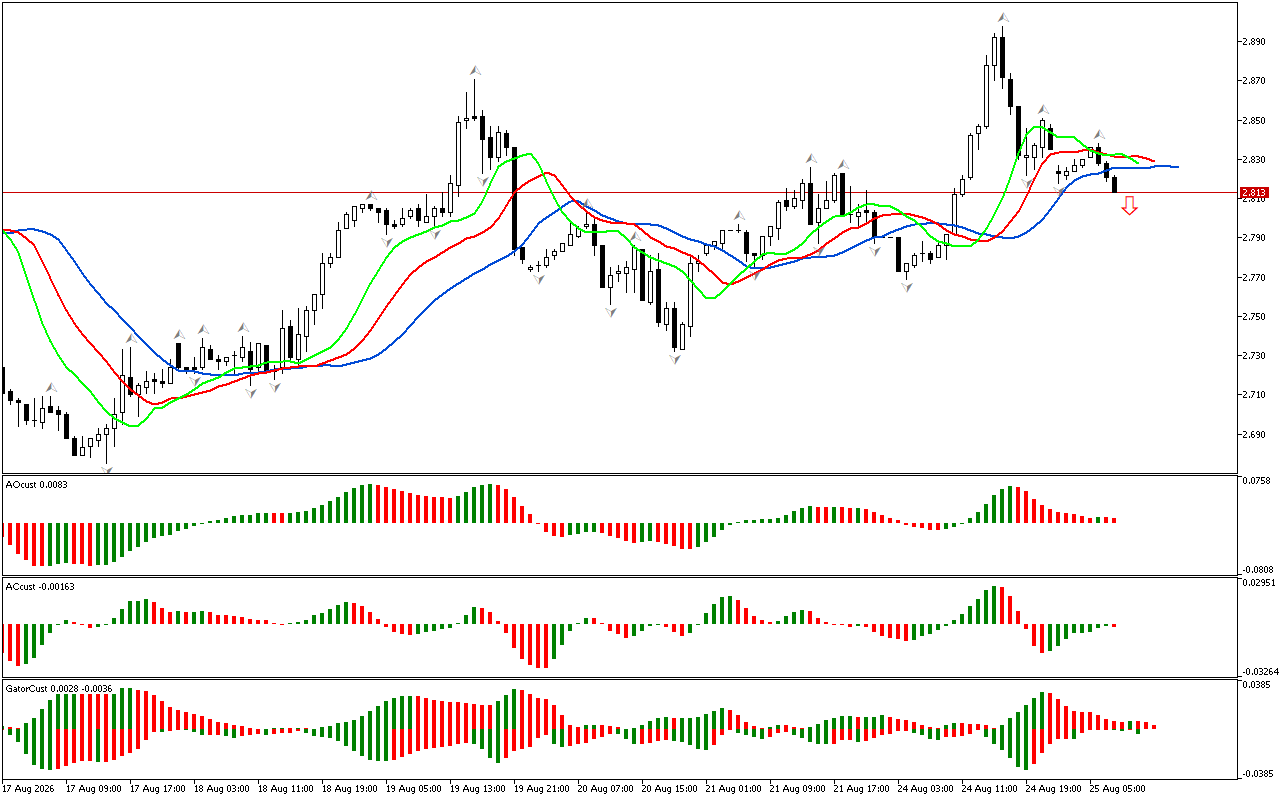
The review begins with the analysis of the first dimension of the market. The price has fallen below the lower fractal, located outside the Alligator’s mouth. Therefore, the phase space is defined as southern. The most probable price change dynamics are a price decrease. To assess the strength and energy of this movement, let’s consider other dimensions of the market, according to the strategy of Bill Williams.
The AO indicator is still above the zero mark.
The green bars have been formed above the green line on the Accelerator Oscillator indicator. It signals either a correction or a trend movement change. It indicates the market’s losing energy to continue moving in southern direction. However, as long as the price remains below the Alligator’s red line, the southern movement remains prevalent.
The last bars on the AC and AO charts are green. The indicators signal that the strength and energy of the southern impulse are experiencing a deceleration. It can be either a reversal of the local trend or a signal about the development of a correction. However, while the price is below the Alligator indicator, the movement in the southern direction remains prevalent.
The histogram of the Gator indicator has not formed a clear signal yet. The color of the histograms changes, indicating a change in market phase.
As a result, there is a southern phase space. At the same time, the signals from other indicators indicate the possible development of a correction. This situation should be used to enter the market at better prices.
📊 Sell Stop 0.78436
❌ Stop Loss 0.78503
After entering the market, Stop Loss is moved along the red line after closing each candle. The profit is fixed by moving Stop Loss, or when opposite signals appear on the AO, AC, Gator indicators.
Leave a Reply