
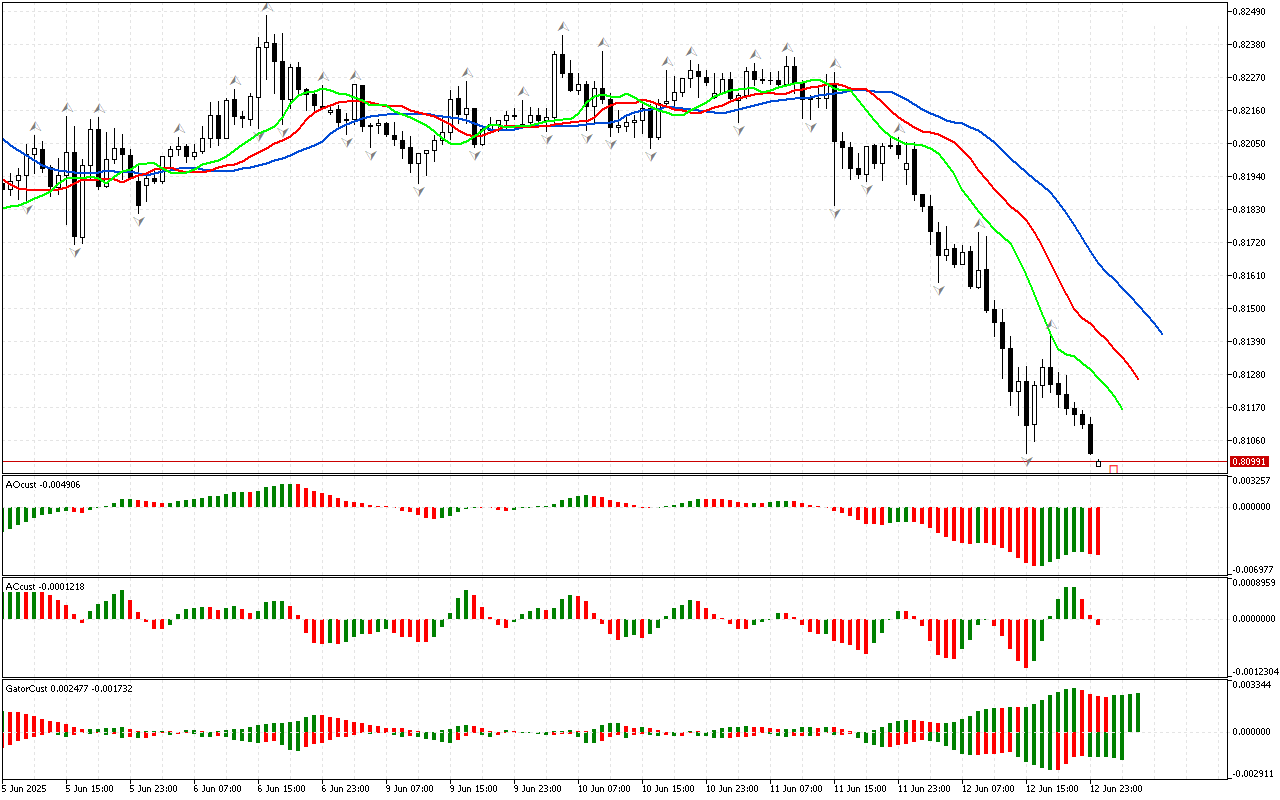
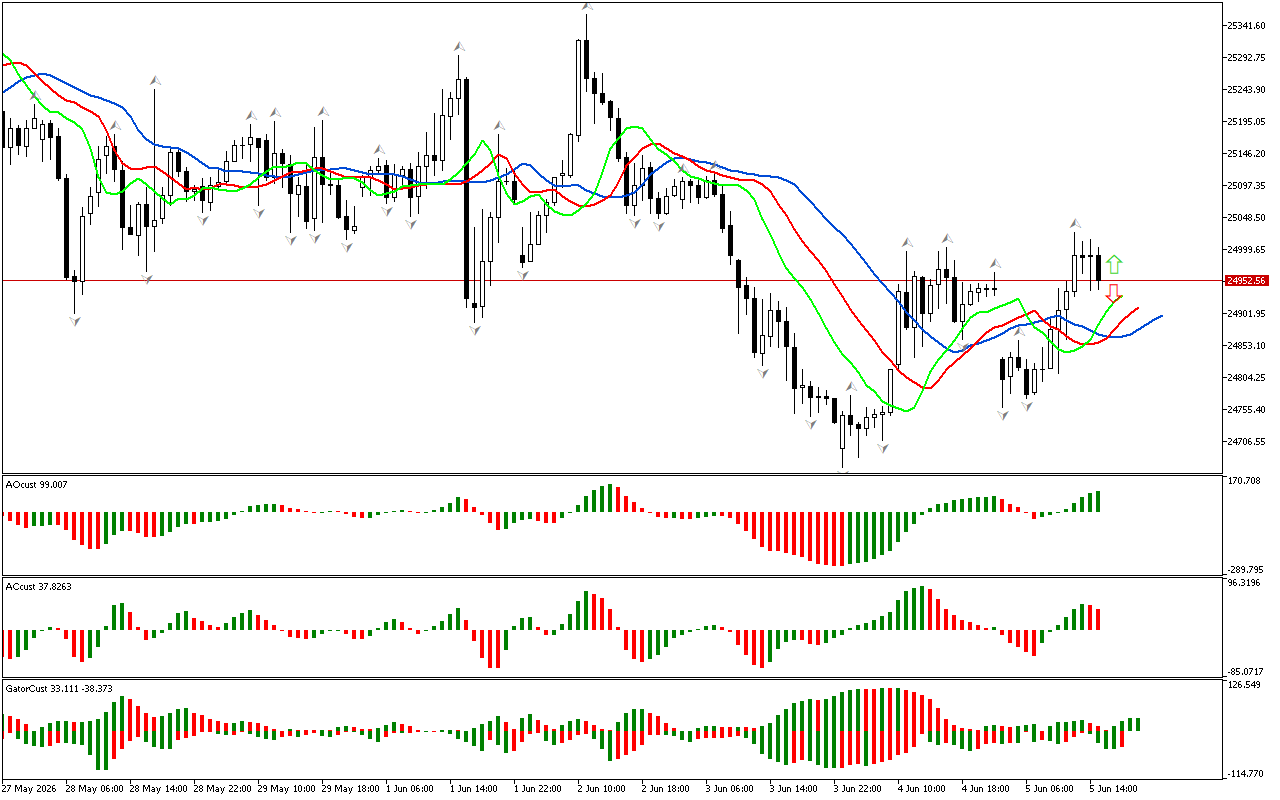
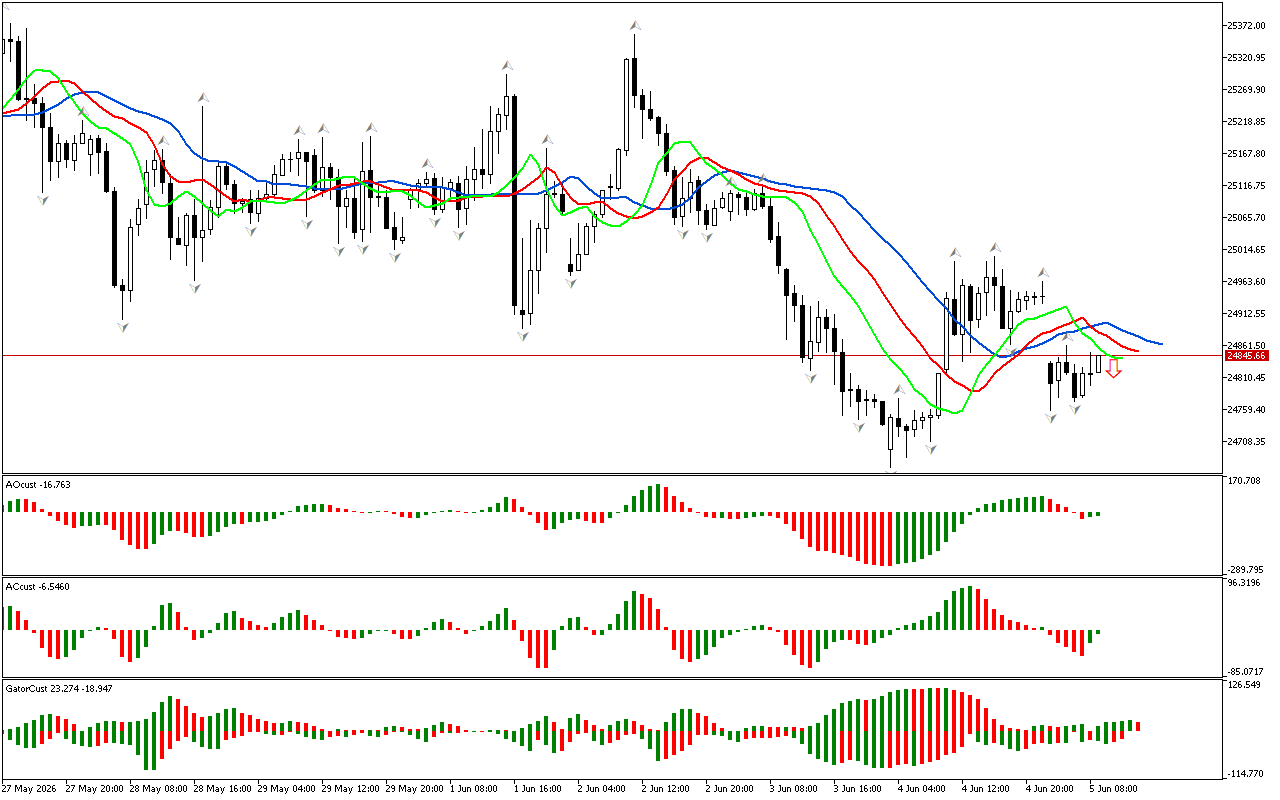
The analysis of the current market situation shows that the phase space is defined as southern. The price has fallen below the lower fractal. This may indicate the beginning of a downward movement. To gain the information about the strength and energy of this movement, let’s pay attention to the positions of other indicators on the chart.
The Alligator confirms the signal of the first phase of the market: its mouth is open.
An inverse Saucer signal has appeared on the Awesome Oscillator indicator. It indicates a possible change in the direction of the market to downward. When this entry point signal appears, the market can be considered when the price falls below the local minimum.
There are red bars, drawn above the zero line on the AC indicator. This signals an increase in energy for movement to the southern direction.
The AC and AO indicators are in the red zone, which indicates that there are strength and energy to continue the downward movement.
A series of green bars is drawn in the Gator indicator. This shows the Alligator’s gluttony. The Hungry Alligator period is the time when a trend movement develops in the market.
As an epilogue to the analysis, the southern direction of price movement is noted to be considered as a priority. At the same time, the indicators contain signals about the possible development of a correction, which should be used to search for entry points at more beneficial prices.
📊 Sell Stop 0.80973
❌ Stop Loss 0.81724
After entering the market, Stop Loss is moved along the red line after closing each candle. The profit is fixed by moving Stop Loss, or when opposite signals appear on the AO, AC, Gator indicators.
USDCHF H1: The Chaos Theory Forecast for the Asian Session on 13.6.2025
Leave a Reply